
What’s the best dashboard software for reporting?
Data has become critical for businesses looking to increase profits and improve efficiency.
As business grows, the number of data sources becomes increasingly overwhelming making it even harder to decipher datasets.
In fact, according to research by Matillion and IDG, the average number of data sources per organization is 400 sources, which makes manual data analysis quite challenging, yet it is a crucial step of data-driven decision making.
There is a clear demand for dashboard software for reporting and data visualization to handle massive organizational data and help business owners glean essential insights.
But as the need increases, it is important to know what to look for in good software.
If you are not sure where to start, in this article I have compiled a list of the best dashboard software for reporting and data visualization to help you make an informed decision.
Let’s get started.

Grow merges data from different sources to provide enterprise-quality data insights.
Owing to its easy-to-use design, your employees can use Grow without technical expertise. Still, it does not compromise on the quality of service.
For starters, besides merging data for you, it also provides a customizable dashboard that allows your team to create clear reports by navigating through data from multiple sources.
When paired with the data reporting feature, you can summarize data using graphs and charts that simplify all the information for you.
You can link your Grow software to your business’s cloud file warehouse or any other data source. If security is a concern to you, Grow is pretty secure with its threat detection, security firewall, and anomaly checker features.
Click the link to start a free trial of Grow and experience its analytics tools firsthand.
If you are a small or medium-sized business, I recommend Grow as it merges different data and delivers it in a simplified manner.
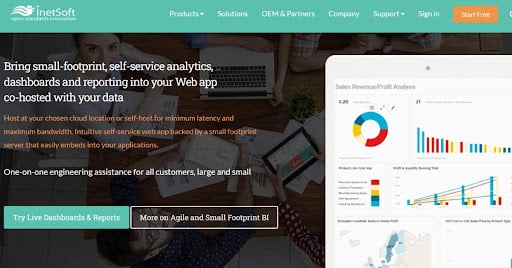
This software is perfect for its embedded reporting.
InetSoft is the best dashboard software for reporting and data visualization as it integrates well with your web app and brings all your business data, reporting, and analytics in one place.
This way you can access all the information you need faster.
One of its remarkable selling points is its small-footprint architecture. Unlike most traditional business intelligence software that require machines with over 7 cores, InetSoft can be deployed to a cloud instance as small as two virtual cores.
Why is this important?
Implementing a small footprint BI such as InetSoft to your solution allows the utilization of cost-effective machines and instances.
Other notable features include agile data mashup, access to third-party proprietary software, and easy integration.
Start a free trial today and learn how InetSoft can transform your business data analysis and reporting for enhanced efficiency and productivity.
Inetsoft is ideal for a start-up thanks to its cloud and hosting flexibility which may save you some bucks.
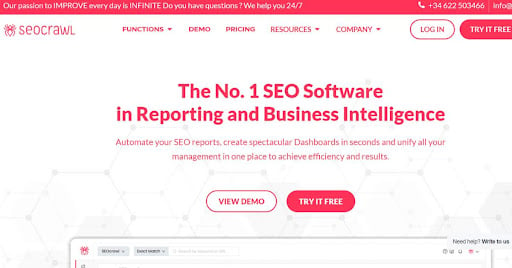
This software enables you to analyze your growth with an SEO dashboard.
SEOcrawl is more of an SEO tool but provides data reports and analytics to help your business grow.
Its SEO dashboard does not just provide analytics, it analyzes and delivers a detailed performance of your projects which includes traffic predictions, performance statistics, and accelerometers.
With features such as recommendations reports that include keywords in a growth trend and keywords with traffic loss, you can optimize your marketing to maximize profits.
Moreover, this SEO software can save you hours wasted on identifying opportunities and SEO priorities. SEOcrawl automatically analyzes data and provides a detailed report that can help you turn your losses into profits.
For hands-on experience with the software, signing up for a free trial today.
This is the dashboard software for your business if you are looking for a professional SEO tool for your marketing and data analytics.
4. SAS Institute
The company combines analytics and data management to turn data into intelligence.
SAS Institute provides business intelligence that can save you both money and time thanks to its AI-enhanced platform that accurately analyzes and reports data.
And since the software needs to work hand in hand with other tools, it can easily integrate with other open-source languages.
This way you can focus on enhancing productivity rather than on seething through tools.
Knowing everything that is happening to your data in real-time can help you predict how to position yourself seamlessly for success, and SAS helps you do that.
It creates compelling charts and graphs that enable big businesses to understand a pool of data. This data is essential for realizing trends, spotting variations, and unearthing the reasons for such variations.
Click here to try SAS software for free and take its reporting features for a spin.
I recommend SAS for large enterprises with massive data that need to be simplified for easy comprehension and analysis.
5. Whatagraph
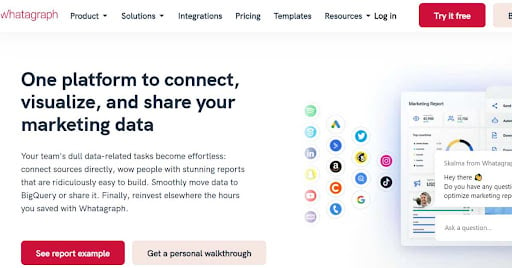
Whatagraph combines data, creates insightful reports, and makes it easy to share.
Analyzing data from multiple sources can be a boring and time-consuming task. But it doesn’t have to be. This software provides a solution and makes all this manual work simpler saving you several hours that can be reinvested elsewhere.
The best thing about Whatagraph is that it houses several essential business tools in one. You do not need separate dashboard software for analyzing data, creating reports, and sharing them.
All that can be done from here. And while it looks a little complicated, it is easy to do all these without extensive expertise thanks to the software’s easy-to-use interface.
However, you can connect Whatagraph with other sources with custom API, native integrations, and BigQuery to leverage multichannel monitoring.
You can schedule a free demo to get hands-on experience.
I recommend Whatagraph for businesses in marketing to leverage data from different sources to optimize profits.
6. Zoho Analytics
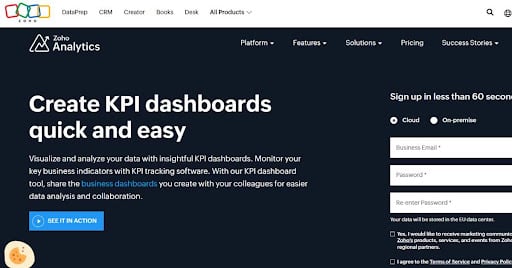
This is a BI and analytics software that helps analyze data.
Zoho has different offerings ranging from cloud BI to CRM.
It makes the list of the best dashboard software for reporting and data visualization because of its ability to use KPIs to analyze data and monitor key business indicators. Additionally, the software allows your employees to share the dashboards they create to enhance collaboration.
Regarding visual analysis, Zoho has plenty of visualization tools including charts, widgets, and tabular views.
These can be used together to develop insightful reports and dashboards which can easily be created using a drag-and-drop interface in the software.
Zoho shakes things up with analytical technologies that augment your data analysis such as What-if Analysis which enables you to simulate different scenarios to find business outcomes.
The software is great for growing businesses looking to get the most out of their data at an affordable rate.
7. Funnel.io

Funnel gives you control over your performance through reporting and analytics.
Imagine a tool that allows you to bring data from different sources together, store it, and transform it quickly for analysis, all in one place.
Well, that is Funnel in a nutshell.
What all this does is eliminate the boring time-consuming tasks and allow your team to focus on the important tasks—improving your marketing.
Owing to its integration abilities, the software can be connected to over 500 platforms where it collects essential data. Furthermore, with security and control as a priority, Funnel allows you to store all that data in a centralized hub ensuring it is always ready for analysis.
With better and faster reports provided by the software, your business can make data-driven decisions that create value for your business.
Funnel is an ideal marketing tool for businesses looking to leverage data to increase profits.
8. Insight Software

This is a software suite of business performance management solutions.
It provides analytics, reporting, and performance management solutions.
So what does integrating this software into your business mean?
Insight does not only provide insight into how your company is doing at the moment but also plots a course toward a successful future. It is a game-changer.
With ever-evolving business demands, there is a need for software that can keep up to eliminate time wastage and errors in reporting. Insight is the best dashboard software for reporting and data visualization because it helps you take charge of your finances.
How?
The software provides automated reporting solutions that enable efficient and accurate reporting and insightful analytics that drive organizational success.
Key features include up-to-date data visualization and analysis and enhanced collaboration through automated workflows.
I recommend this software for large enterprises with large financial data to analyze and report on as it’s best suited for more established organizations.
9. Neuro
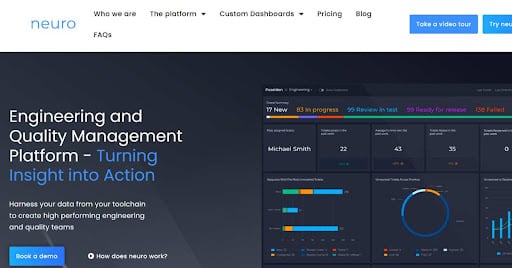
This is an analytics platform that provides engineering and quality management insight.
Neuro is the best dashboard software for reporting and data visualization thanks to its ability to integrate seamlessly with your tool stack out of the box, eliminating the need to replace them.
The integration will allow you to harness complex data from multiple sources which is simplified in a way you can understand easily.
Additionally, the software through smart dashboards provides actionable insights that help you keep track of your engineering and quality performance.
And all this doesn’t have to take a lot of your time as tasks such as reporting can be automated on the software.
It is ideal for large enterprises in need of efficient tools to monitor engineering and quality performance. It can help to keep your team in line with business priorities.
10. Tableau

Tableau provides insightful data and helps expedite decision-making.
This software offers a plethora of features all geared toward delivering the best data visualization to help drive your business.
Such features include ready-to-use dashboards which are also customizable enabling you to customize everything to your unique case regardless of industry, or department.
It is worth noting that the software recognizes that data exploration can be time-consuming and complicated. Therefore, Tableau ensures that you do not have a hard time understanding information thanks to the Explain Data feature.
Once you locate key data points, the feature can provide AI-driven answers and easy explanations.
Other features worth mentioning are Hyper, Geospatial Analytics, and LOD expressions, to name a few.
I recommend Tableau for large companies with a vast volume of data that may be time-consuming to interpret.
Conclusion
The success of a business is highly dependent on how you understand the core aspects of the business.
Therefore, it is essential to analyze real-time data to understand how your business is performing and how you can position yourself for success.
However, manually doing this can be a challenge for your team.
Incorporating an effective dashboard software for reporting and data visualization will help you bring together a vast amount of data from different sources such as social media, analyze it, and simplify it in a manner you can understand.
The best dashboard software for reporting and data visualization should therefore have an easy-to-use interface, provide insightful reports and analytics, and bring all your data together.
Some options you can consider include Tableau, Funnel, and Insight Software.
Try any of them today or sign up for a free trial to find out how they can transform your data analysis and visualization.
Interesting Related Article: “How to Pick the Best Performance Marketing Software?“


