
After Germany sold 50,000 BTC, Bitcoin is back above $60,000. This is the perfect opportunity to observe the first favorable signals of a bull run on the cryptocurrency market. Let's take a look back at the 5 on-chain charts to follow to make the most of the bull run.
A bull run in the starting blocks
While the crypto market trend has been bullish since 2023, The signs in favor of a bull run have been multiplying in recent months. However, the indicators allowing us to observe this sudden rise in the market have existed for several years, starting with the profit offer.
📩 Get our 64-page report on the state of the crypto market for free
The supply in profit is an indicator that represents the profitability of investors. Thanks to the transparency of the blockchain, it is possible to know the price and the date of purchase of the different holders of cryptocurrencies. Thus, This tool reveals periods of market overheatingwhere investor profitability is at its highest:
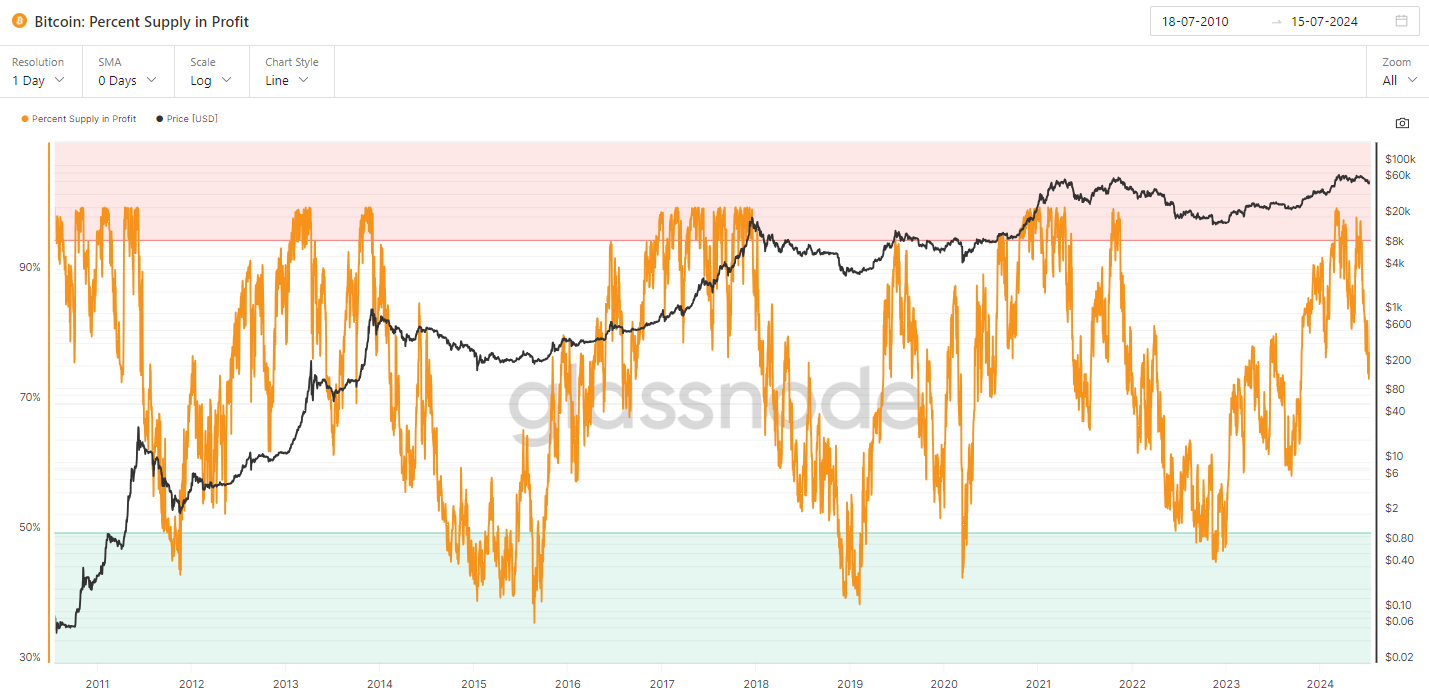
Supply in profit (in orange) on the Bitcoin (BTC) market between 2011 and 2024 – Glassnode
Bitcoin being the metronome of cryptocurrencies, its cycles influence the entire market. As we observe above, the indicator shows the periods that are extremely beneficial for investors. A profit offer exceeding 95% continuously for several months is characteristic of a bull run..
👉 Crypto: how to analyze Bitcoin cycles with the SOPR indicator?
To analyze the Bitcoin price, this indicator is often accompanied by a second tool: the STH/LTH MVRV. The latter compares the capitalization of Bitcoin and its capitalization realized among short-term investors. (STH) and long term (LTH). The first group has held their BTC for less than 155 days. The members of the second group have held their BTC for more than 155 days.
Historically, the close of a bull run is evidence of a reversal of trend between STH and LTHLong-term investors record more unrealized profits than their counterparts over a period of months.
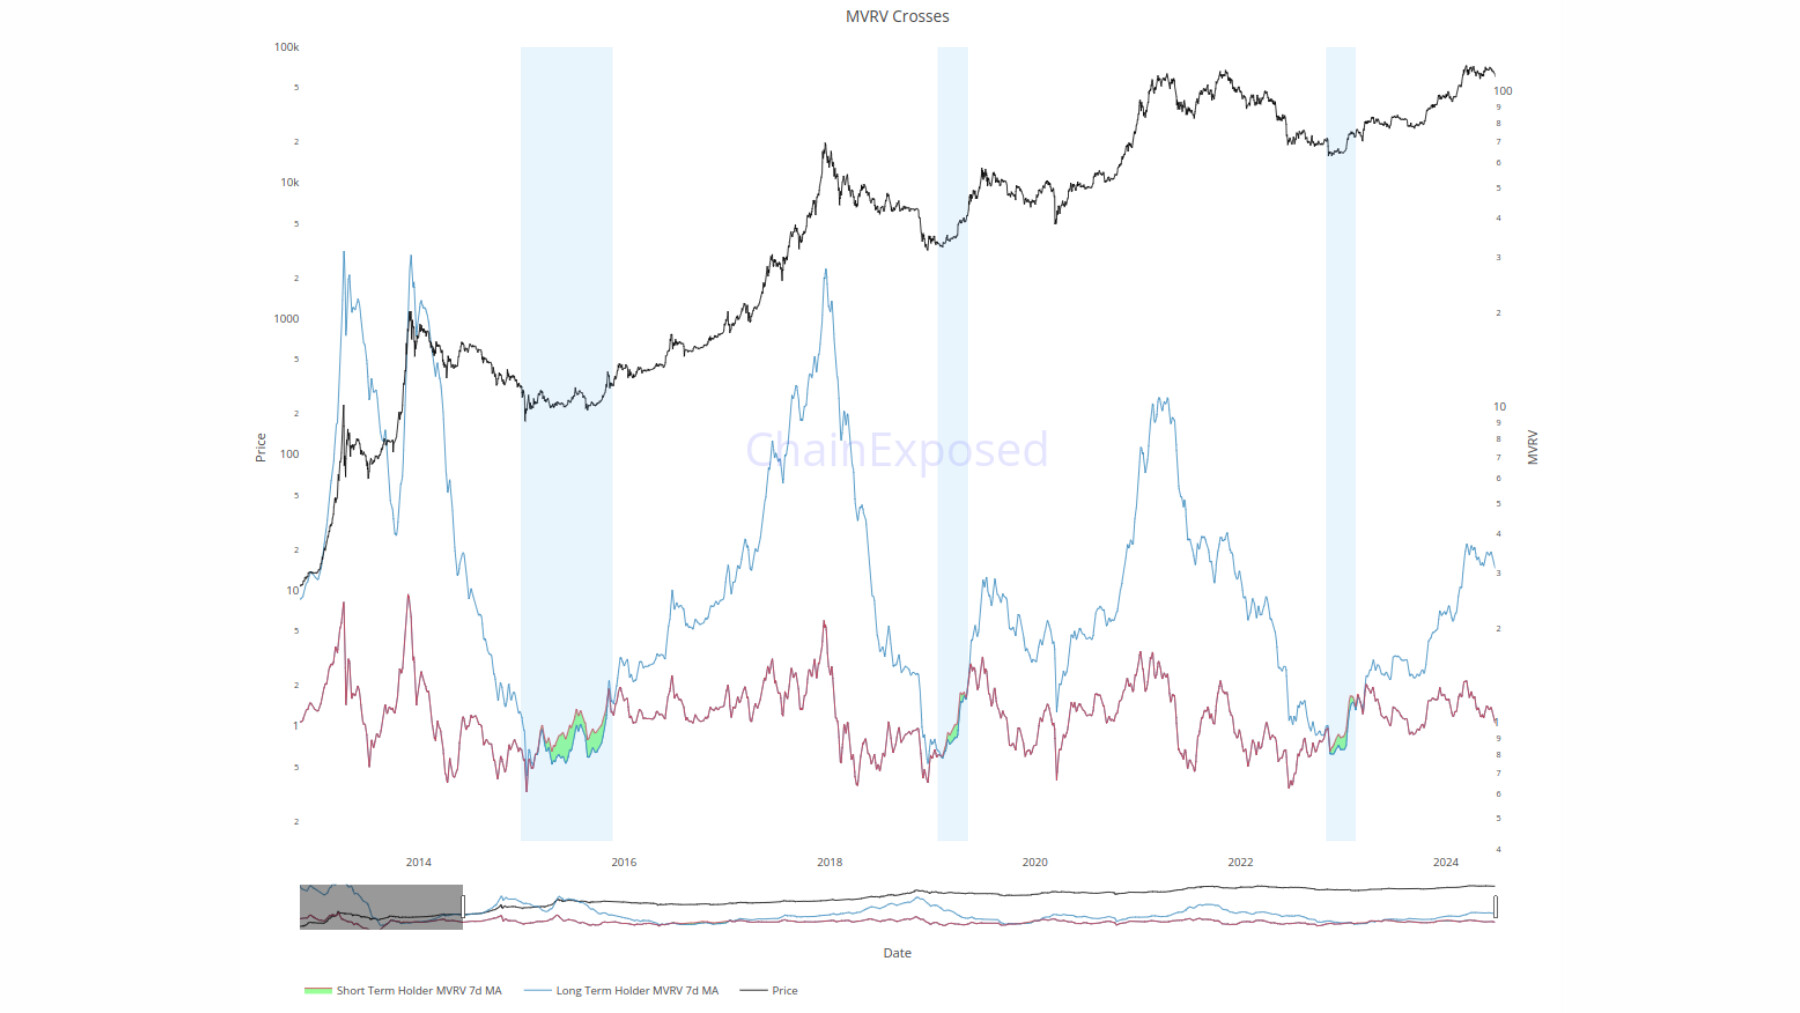
Ratio between MVRV STH (red) and MVRV LTH (blue) from 2013 to 2024
Therefore, the intersection of these two cohorts with LTHs in the lead represents the nerve center of the market. It designates the moment when the triggering of the bull run is confirmed..
These two indicators rely mainly on the latent gains and losses of different investors. However, the indicators for detecting a bull run do not systematically rely on this on-chain data. This is the case of the “supply movement”, which offers a 360-degree panorama of … [75 % restants].


