The price action on Bitcoin has drawn a seemingly endless range over the last 3 months. In recent days, a bearish flow seems to be building in search of a confrontation with the supports of the range. So, what are the levels to watch for on BTC in this coming battle?
It is Monday June 17, 2024 and the price of Bitcoin (BTC) is moving around $66,000.
This Monday morning, the performance map of the crypto ecosystem is reddish. The phase of latent consolidation in which we are evolving does not seem to want to end.
Some of the strongest tokens in recent weeks are correcting more intensely, at a time when Bitcoin remains strong, only recovering 10% from its annual highs.
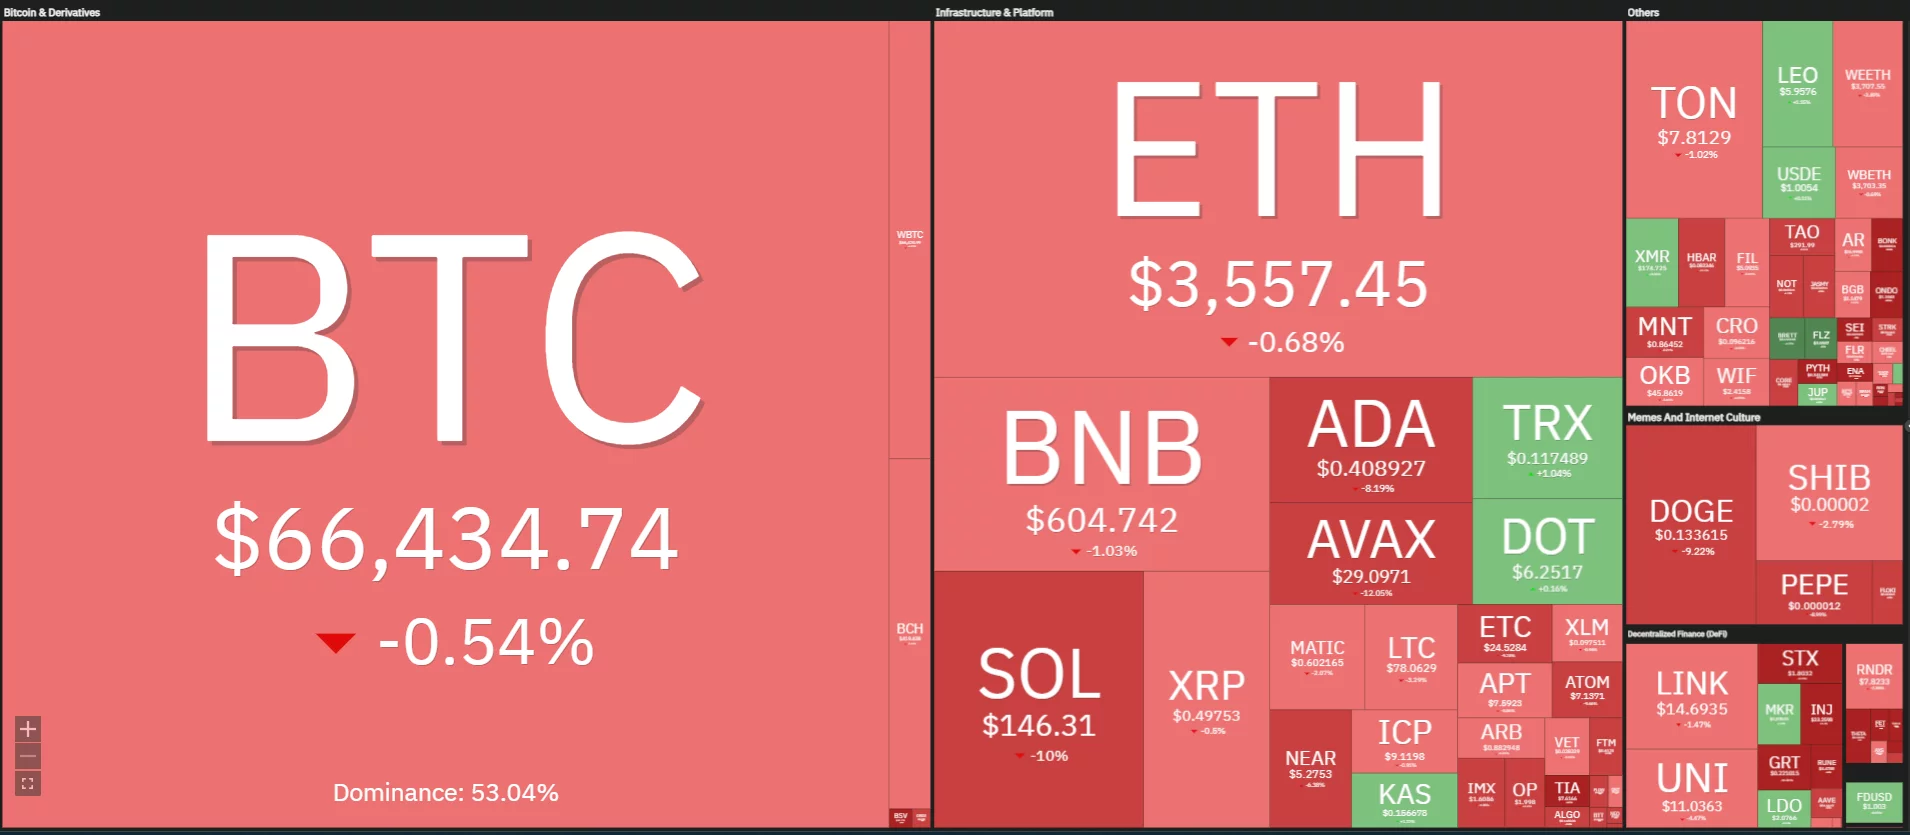
Mapping the performance of the crypto ecosystem over the last week
Bitcoin once again puts pressure on altcoin holders. Its dominance does not weaken, well established between 54% and 56%.
It is interesting to see how the 20-week moving average supports the bullish flow in an alignment of all averages upwards. In the coming weeks, we should witness the meeting between this bullish flow and the 56% level, which until now has always acted as a barrier.
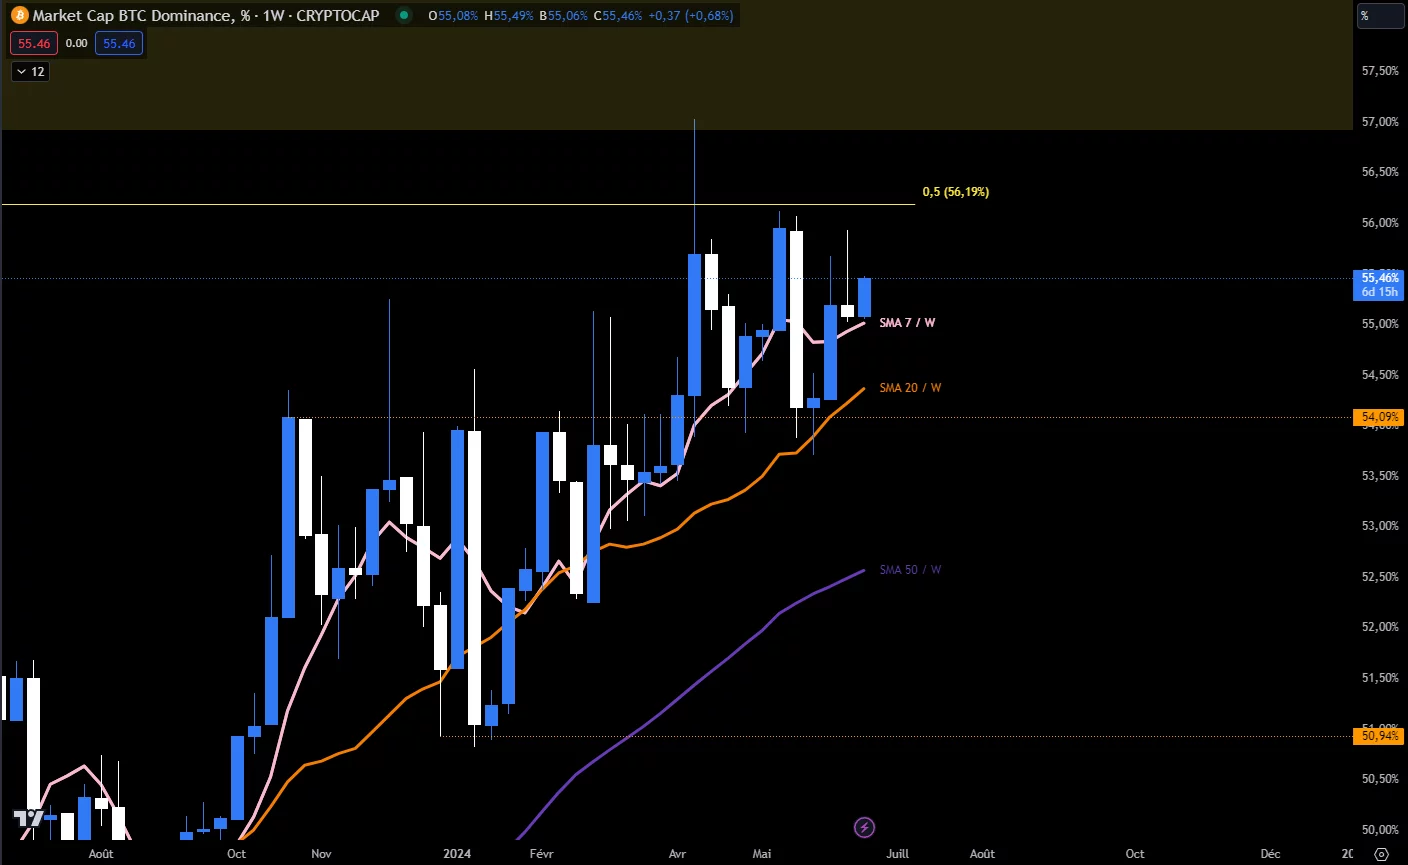
Evolution of Bitcoin’s dominance on a weekly basis
📈 Surf the bull run by surrounding yourself with experts! Join us now at Cryptoast Research
Cryptoast Research: Don’t waste this bull run, surround yourself with experts
Profit taking on Bitcoin Spot ETFs
| Pairs with Bitcoin | 24 hours | 7 days | 1 month |
| Bitcoin/USDT | -0.20% | -5.10% | -1.90% |
| ETH/Bitcoin | -0.20% | +1.00% | +14.20% |
Institutional purchases are slowing down, marking the end of a record buying streak. The volumes of this investor class have, however, been stable for 3 months; interest is therefore still present. Blackrock’s ETF, the “IBIT”, stood out by remaining positive during the last 2 stock market sessions unlike all other spot Bitcoin ETFs in the United States.
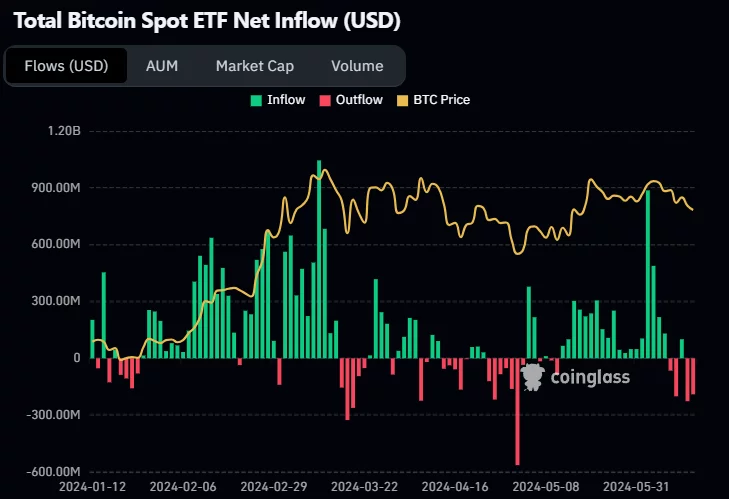
History of flows on spot Bitcoin ETFs
Buy cryptos on eToro
BTC works on the equilibrium of the range
The wide range in which Bitcoin operates is still in place despite renewed volatility last week. This, however, closed on an absorption above the middle of the range in perfect confluence with the 7-week moving average. This close is a good signal in a week that will offer few macroeconomic catalysts. On this subject, the most important meeting will take place on Thursday with some data on the job market.
The objective for Bitcoin this week is to hold the middle of its range and the 7-week moving average in order to maintain positive polarity. In the event of a bearish excess, the 20-week moving average and the bottom of the range could cause prices to react.
That said, if closing the week below the 2 moving averages 7 and 20 weeks would mark a sign of degradation, let’s keep in mind that we are in a range and that the latter is part of an upward trend of several months. Thus, the probability of maintaining the range in order to exit from the north remains higher than the opposite scenario.
👉 How to easily buy Bitcoin (BTC) in 2024?
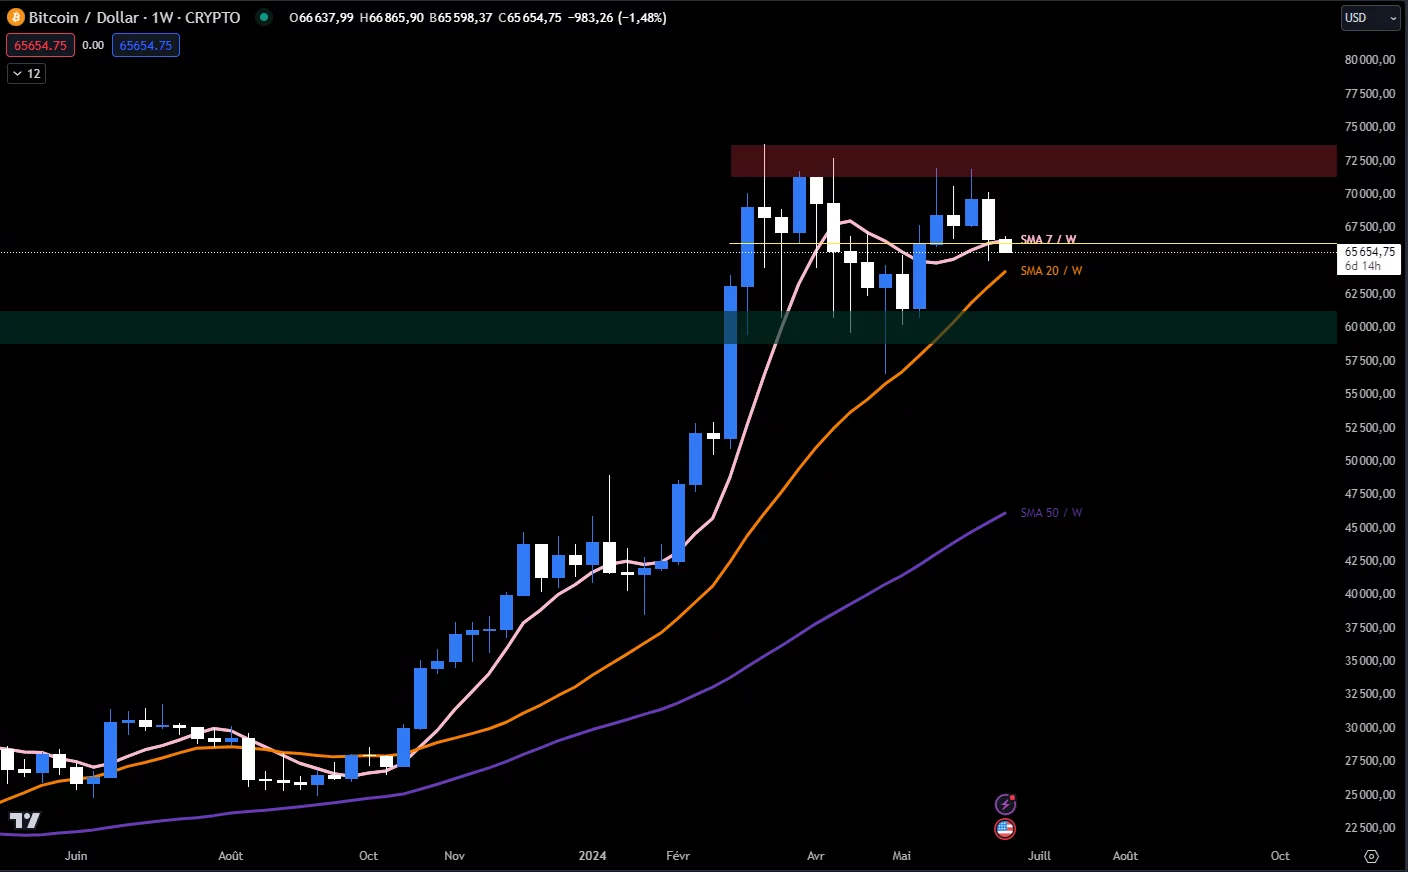
Weekly Bitcoin price chart
On a daily basis, the Bollinger bands open and prices are stuck between the low BB and the 7-day moving average. The configuration gradually takes the form of a bearish flow with a 20-day average moving south. The 50-day moving average is being tested at the time of writing.
Closing today’s candle below the 50 moving average would trigger a first bearish alert with the objectives that we cited previously in mind:
- 20-week moving average : $64,000;
- Lower limit of the range : zone of 59,000 to 62,000 dollars.
The objective of the next few days for the bullish camp will be to close above the 7-day moving average in order to degrade the bearish trend that is taking hold. The bearish camp, on the contrary, must maintain the flow and press the supports in search of $56,000.
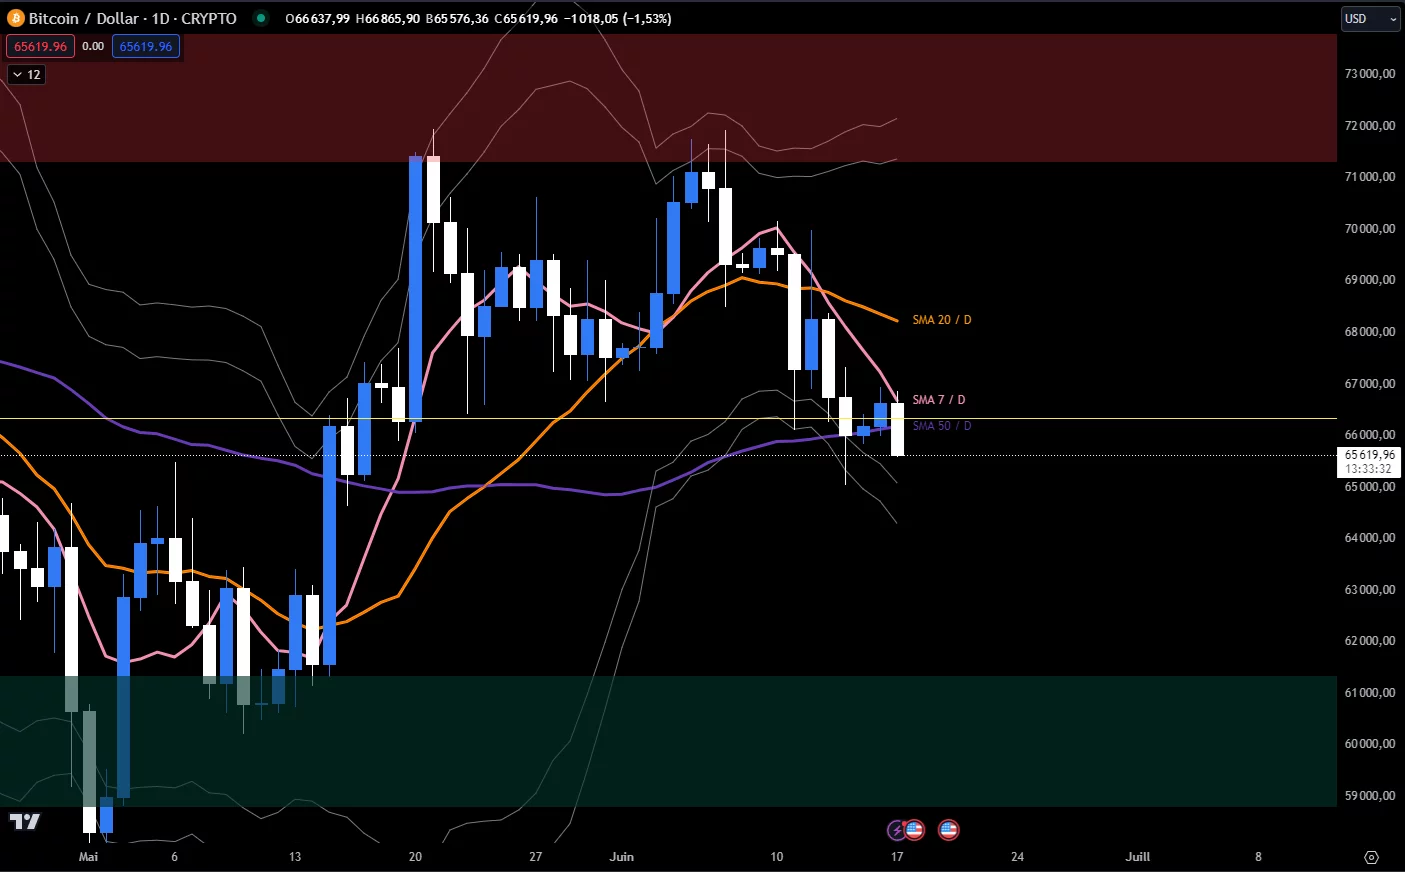
Bitcoin price graph in daily data
👉 Would you like to discover more technical analyzes on Bitcoin or altcoins? Join our premium Cryptoast Research group where we share altcoin analysis charts every week!
Cryptoast Research: Don’t waste this bull run, surround yourself with experts
In summary, Bitcoin is still stuck in its range. If the weekly trend is not challenged, the daily chart shows signs of weakness. In addition, the supports are faced with the formation of a bearish flow which could gradually gain speed.
So, do you think BTC can maintain its range? Don’t hesitate to give us your opinion in the comments.
Have a nice day and we’ll see you next week for a new analysis of Bitcoin.
Sources: TradingView, Coinglass, Glassnode
Newsletter 🍞
Receive a summary of crypto news every Monday by email 👌
What you need to know about affiliate links. This page may feature investment-related assets, products or services. Some links in this article may be affiliated. This means that if you buy a product or register on a site from this article, our partner pays us a commission. This allows us to continue to offer you original and useful content. There is no harm to you and you can even get a bonus using our links.
Investments in cryptocurrencies are risky. Cryptoast is not responsible for the quality of the products or services presented on this page and cannot be held responsible, directly or indirectly, for any damage or loss caused following the use of a good or service highlighted in this article. Investments related to crypto-assets are risky by nature, readers should do their own research before taking any action and only invest within the limits of their financial capabilities. This article does not constitute investment advice.
AMF recommendations. There is no guaranteed high return, a product with high return potential involves high risk. This risk-taking must be in line with your project, your investment horizon and your capacity to lose part of this savings. Do not invest if you are not prepared to lose all or part of your capital.
To go further, read our Financial Situation, Media Transparency and Legal Notices pages.

