Spot ETFs seem to be slipping through investors' fingers: while there is no doubt about their upcoming launch, the exact date of their implementation remains unknown. Between disappointment and impatience, what does the price action on ETH show?
It is Thursday, July 4, 2024, and the ETH price is hovering around $3,150.
Hello, today is Thursday, July 4, 2024, an American national holiday and a day when the New York markets are closed. In recent days, we have been experiencing a selling attack that is testing the crypto-asset supports.
Additional excess in search of liquidity or medium-term turnaround? A legitimate question that we can ask ourselves and which will find an answer in the coming days.
Ethereum has not escaped the bearish movement of recent days, despite a very good half-yearly closing. Where are we technically on the second most capitalized cryptocurrency on the market?
Cryptoast Research: Don't Spoil This Bull Run, Surround Yourself With Experts
Ethereum Flips into Negative Polarity Zone
| Pairs with Ethereum | 24 hours | 7 days | 1 month |
| Ethereum/USDT | -5.30% | -6.10% | -15.60% |
| Ethereum/Bitcoin | -0.40% | -1.30% | +0.30% |

We have been monitoring the symmetrical triangle in which ETH is evolving for several weeks. If this week's close is not in place, price action moves below $3,350, reversing the asset's polarity in its compression zone.
At this point, the focus is on the south, with the top of the primary trend channel around $3,000 as the target. In excess, we could visit the 0.382 retracement of the rise from the bear market lows at $2,800.
That being said, a show of strength for ETH would be to chasing liquidity once again in view of a new close above $3,400This movement would take the market by surprise, as it mainly shorts the asset.
Buy crypto on eToro
However, the most likely scenario given the strength of this week's candle is to settle in and build a reversal structure in the lower part of the triangle. This hypothesis is based on the underlying trend which remains bullish as well as the medium-term trend. Consequently, Buyers should re-represent themselves if an opportunity arises.
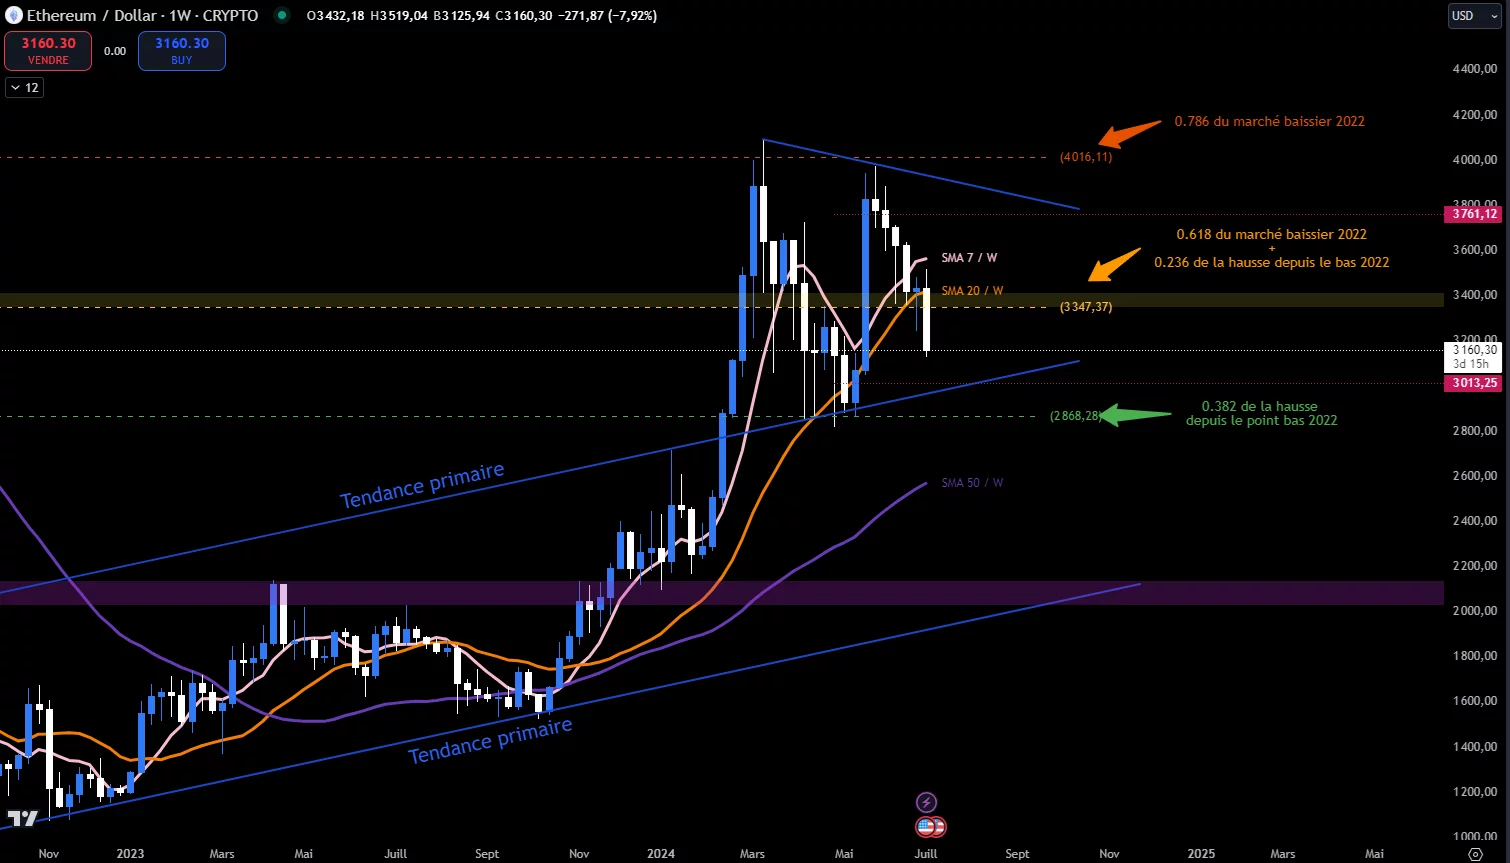
ETH Price Chart Weekly
On a daily basis, The bearish impulsive move is supported by the 20-day moving average which constantly rejects prices refusing the SMA7 and SMA20 crossing. If the 50-day average remains bullish, we could see a much more significant deterioration if the latter were to align with its little sisters.
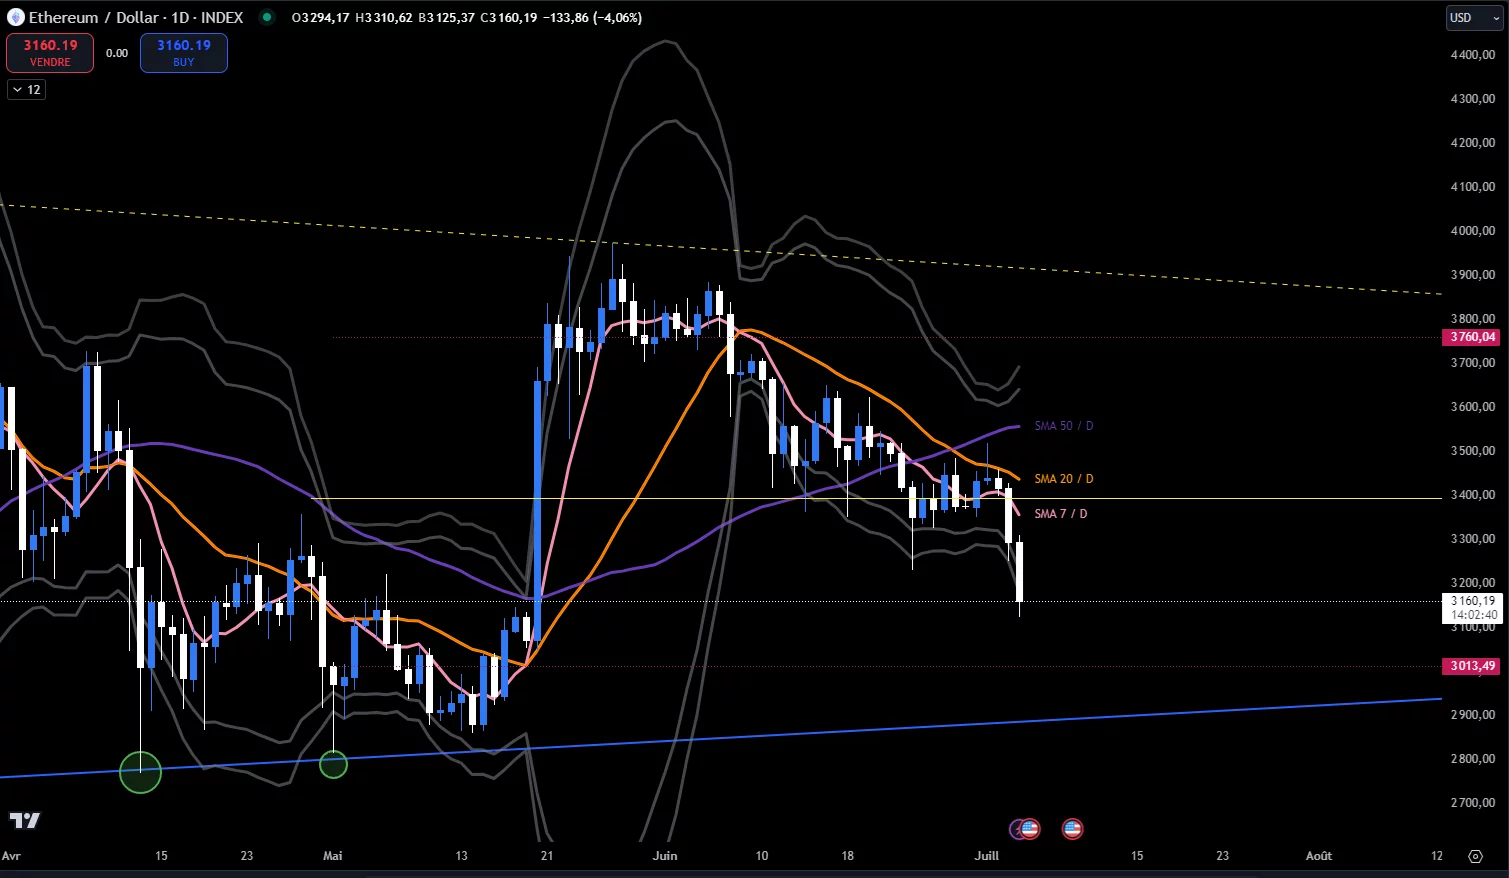
ETH price chart daily
Join the Cryptoast community on Discord
ETH is losing ground against altcoins!
Ethereum, which until now had shown a lot of strength to the detriment of a struggling altcoin market, seems to be experiencing a slight catch-up.
Indeed, the chart against all altcoins continues the decline initiated following the rejection of the resistance around 0.7. The 7-week moving average is being tested. This support is the guarantor of a balance of Ethereum against the rest of the market.
If the support gives way, a return to the middle of the range could occur, demonstrating relative weakness for Ether against the rest of the market.
Many altcoins are sitting on significant supports. A very big purge has been carried out, sending them back to the edge of a technical abyss. TheWith ETH having some margin, it seems consistent to see it lose strength, for a while only.
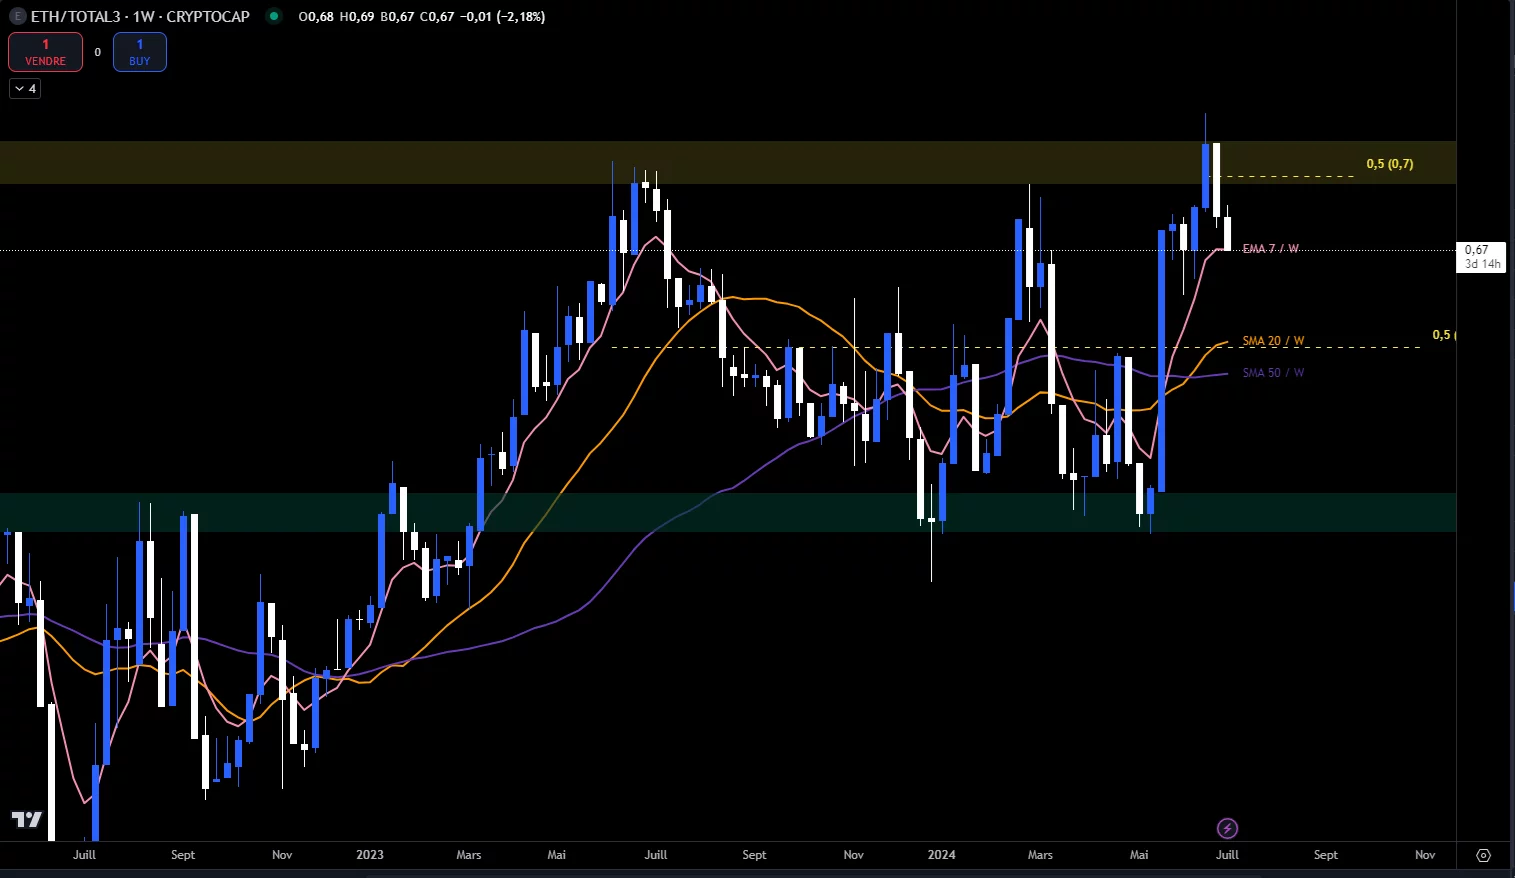
ETH Price Chart vs Altcoin Market
Cryptoast Research: Don't Spoil This Bull Run, Surround Yourself With Experts
In summary, Ethereum is well anchored in its long-term bullish trend. On a daily basis, the trend is bearish and seems to be looking for new support in order to slow down the start of an impulsive phase. The symmetrical triangle is still relevant and should offer a first major support level at $3,000.
Against the rest of the altcoins, Ethereum is losing relative strength. This is likely a short-lived catch-up due to an excessive purge in the market that had previously preserved ETH.
So, do you think ETH can outperform the crypto market again? Please feel free to give us your opinion in the comments.
Have a great day and we'll see you next week for another technical analysis of altcoins.
Sources: TradingView, Coinglass, GlassnodeETF
The #1 Crypto Newsletter
Receive a daily crypto news recap by email
What you need to know about affiliate links. This page may feature investment-related assets, products, or services. Some links in this article may be affiliate links. This means that if you purchase a product or sign up for a site from this article, our partner pays us a commission. This allows us to continue to provide you with original and useful content. There is no impact on you and you can even get a bonus for using our links.
Investing in cryptocurrencies is risky. Cryptoast is not responsible for the quality of the products or services presented on this page and could not be held responsible, directly or indirectly, for any damage or loss caused following the use of a good or service highlighted in this article. Investments related to crypto-assets are risky by nature, readers must do their own research before taking any action and only invest within the limits of their financial capacities. This article does not constitute investment advice.
AMF recommendations. There is no guaranteed high return, a product with a high return potential implies a high risk. This risk-taking must be in line with your project, your investment horizon and your ability to lose part of these savings. Do not invest if you are not prepared to lose all or part of your capital.
To go further, read our Financial Situation, Media Transparency and Legal Notices pages.
