BTC converted the resistance at $24,000 into support and reached $28,000. Can we say that the bear market is over? To answer this question, today we are conducting a broad-spectrum study of the BTC market. On-chain analysis of the situation.
Bitcoin pushes towards $28,000
The past few weeks have been emotionally charged for BTC market participants. Between the bankruptcy of three cryptocurrency-friendly banksthe fall in US stocks and the surge in the price of Bitcoin (BTC) towards 28,000 dollars, the news of the sector has been very eventful.
While BTC converted resistance at $24,000 into support and achieves the price targets mentioned during theon-chain analysis of week 7the question now is whether the uptrend is permanently established: is the bear market over?
To answer this question, today we will observe the market from several angles, including:
- the latent and realized returns of the participants;
- the on-chain activity of the Bitcoin network;
- accumulation/distribution behavior.
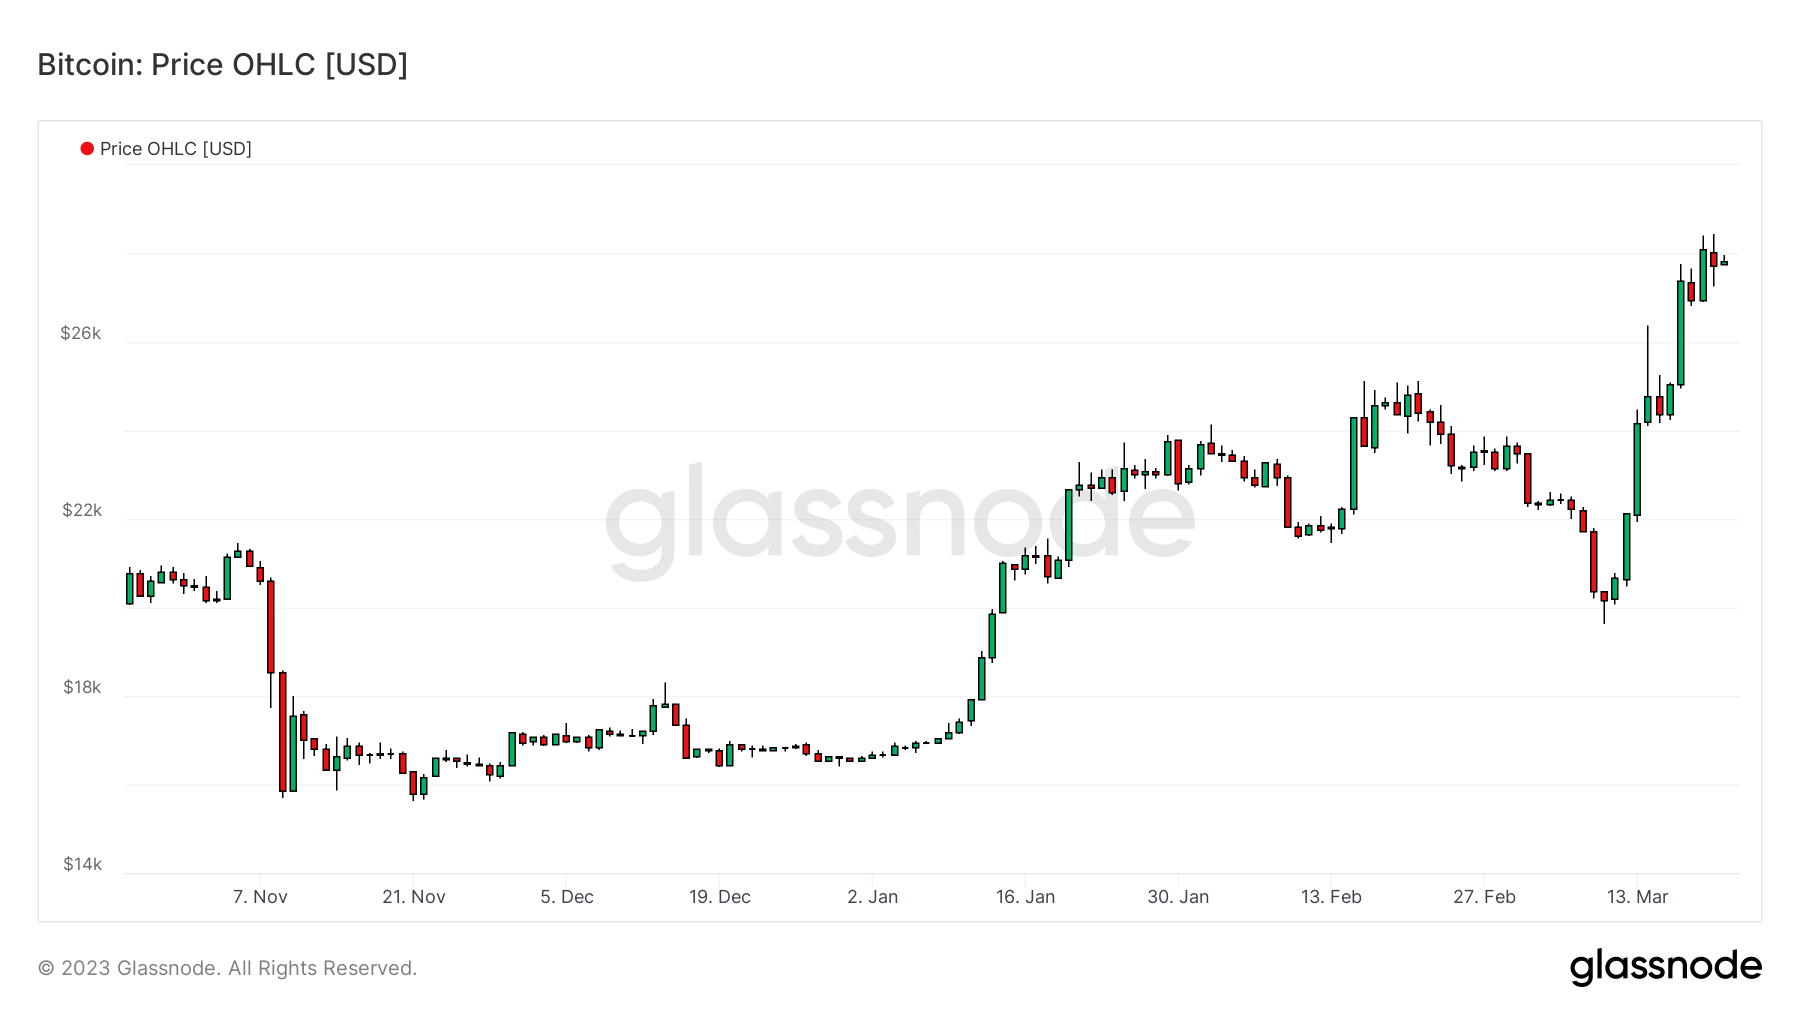
Figure 1: Daily price of BTC

Take your investments to the next level with the analyzes of Prof Chaîne

Return of profits in the BTC market
The latent profitability, held in the profit/loss BTC supply, is a great way to estimate our current situation. Each end of a bearish cycle is marked by a clear improvement in market profitability and signaled by a rapid rise the amount of BTC in profit.
For the moment, the current cycle perfectly reproduces this dynamic, visible in blue below. January saw the largest increase in percentage of supply in profit since the end of 2021.
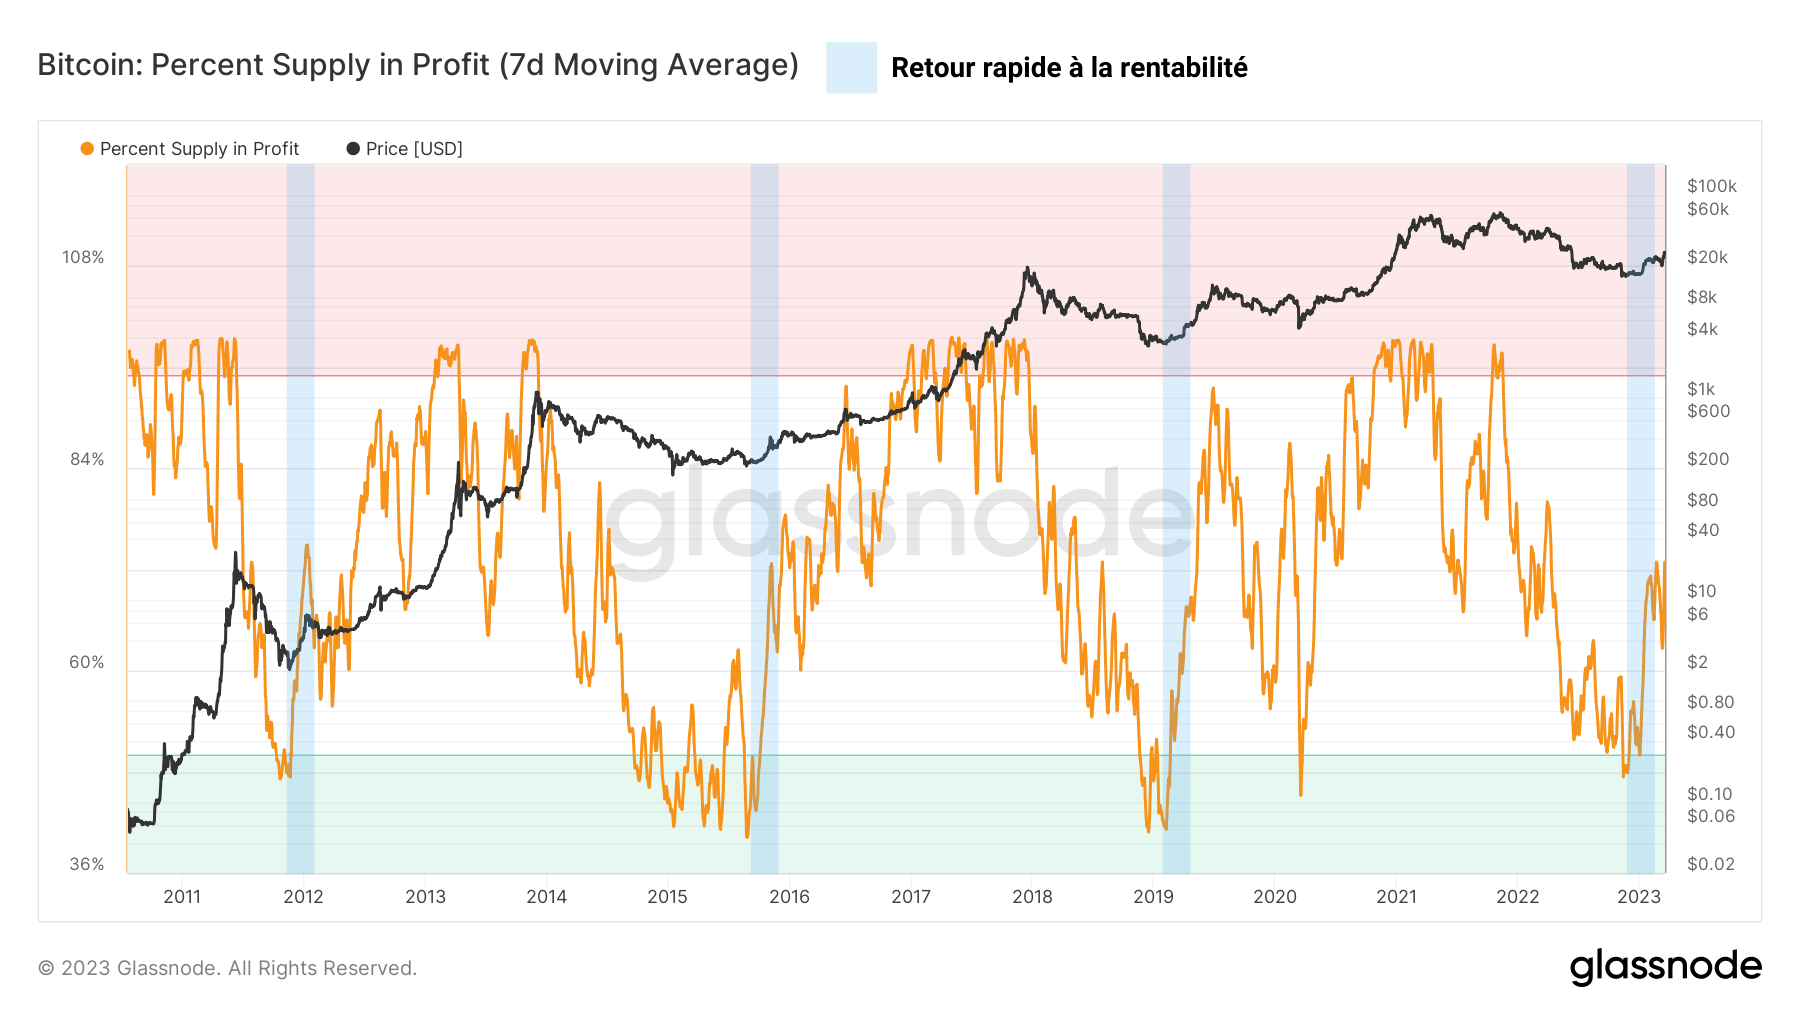
Figure 2: Percentage of BTC supply in profit
This strong return of the profitability of the offer occurs at each end of the bear market and historically favors a long-term bullish bias.
Who says improving the profitability of BTC in circulation says incentive to take profit. Because of this, the take-profit/loss dominance helps identify periods when the bias is bullish/bearish in the BTC market.
In order to verify that this does not only apply to BTC and that it is indeed the whole market which is moving upwards, I recently designed the following graph:
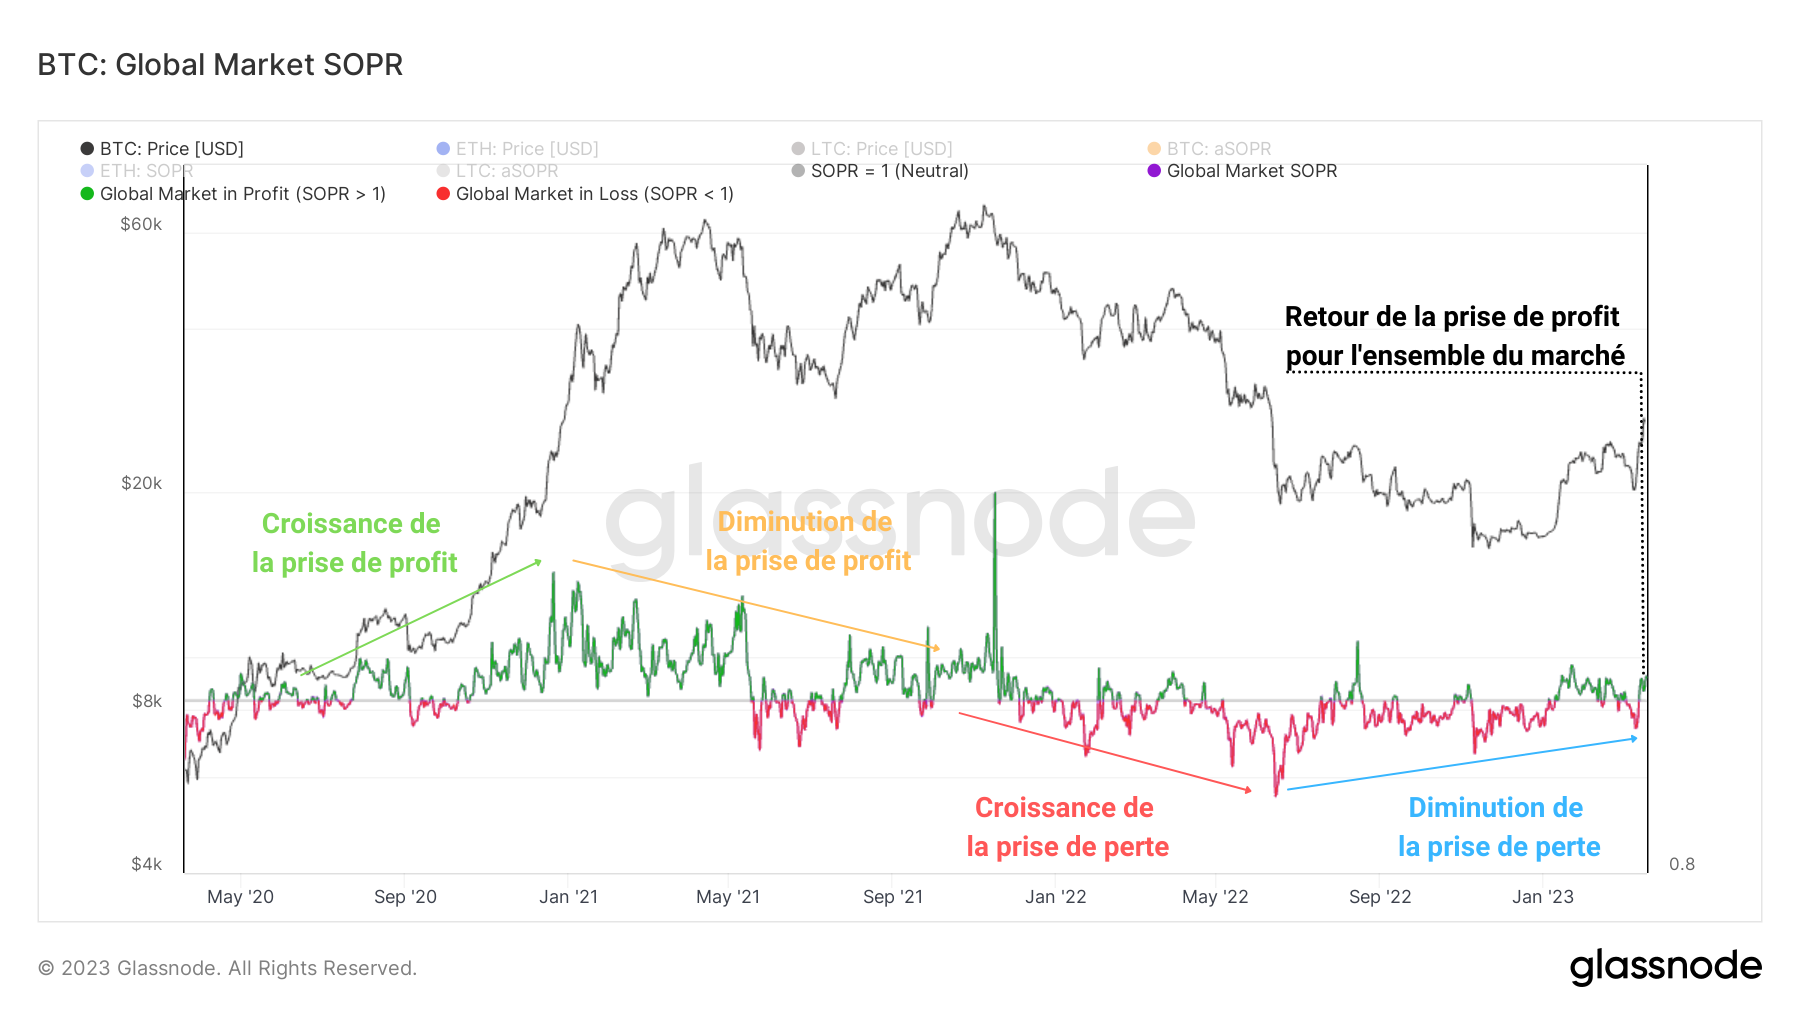
Figure 3: Global SOPR Ratio
Measuring the average profitability ratios (SOPR) of BTC, ETH and LTC, the oscillator below illustrates the economic cycles of the sector and determine if take profit/loss dominates at any given time.
After a period of declining loss taking following the fall of the Terra (LUNA) ecosystem – and the resulting bankruptcies of Celsius and 3AC – in June 2022, the cryptocurrency market is currently finalizing its transition to a take-profit regime.
This type of market structure favors the establishment of a long-term bullish bias and augurs a growth in profitability achieved in the months to come.

The No. 1 exchange in the world – Regulated in France
10% off your fees with code SVULQ98B

On-chain activity of the Bitcoin network
Another angle of study bringing confluence to our observations is the notable recovery of on-chain activity on the Bitcoin network.
In effect, a palpable sign of interest has been apparent since the start of 2023while the number of active entities increased by almost 90,000 active participants per day.
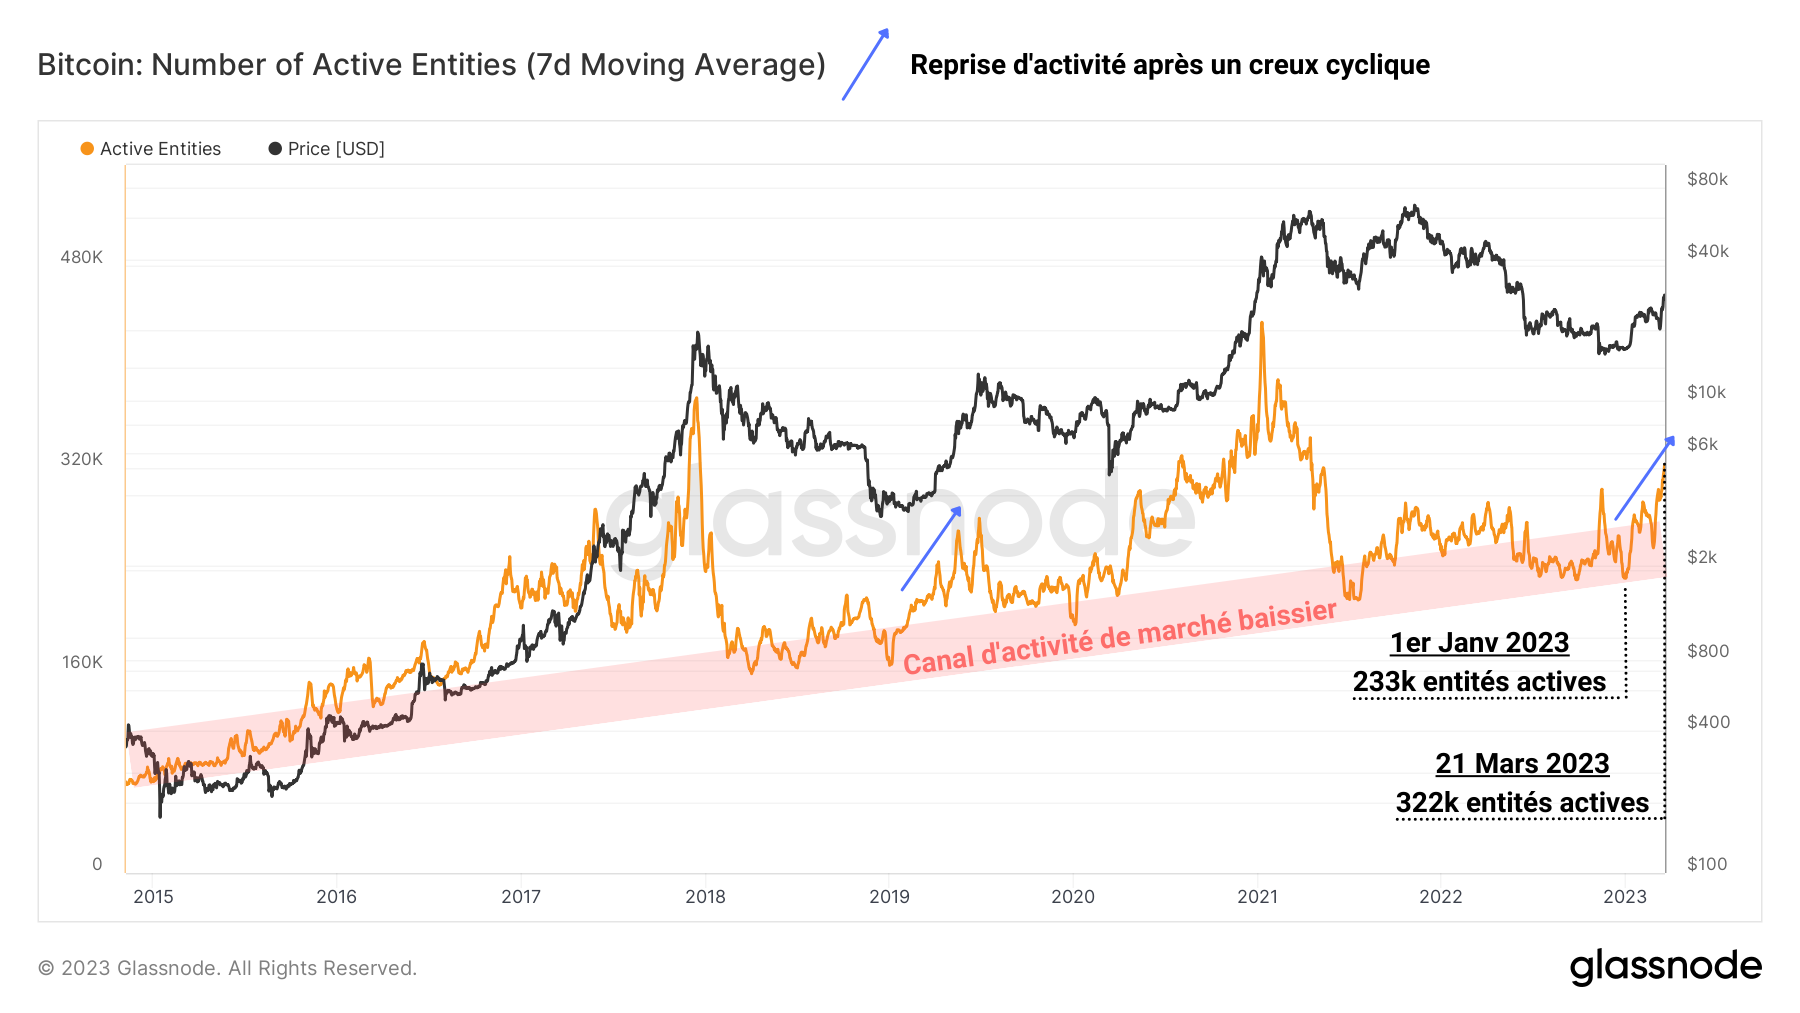
Figure 4: Active entities
This increase in activity is reminiscent of that of 2019, where BTC holders had shown considerable demand for block space after the bottom of the bear market of 2017 – 2018.
Additionally, the metric has recently broken out of the bear market activity channel (in red), indicating the market shift to a more sustained use regime.

https://www.youtube.com/watch?v=G-IHylyThe8
Accumulation behavior returns
The accumulation behavior of the participants seems to confirm this bullish momentum. As mentioned during theweek 9 analysisthe accumulation begins to manifest following the distribution of the past weeks.
Although this trend is still in its infancy, it is part of a loop including the last three cycles of the BTC market.
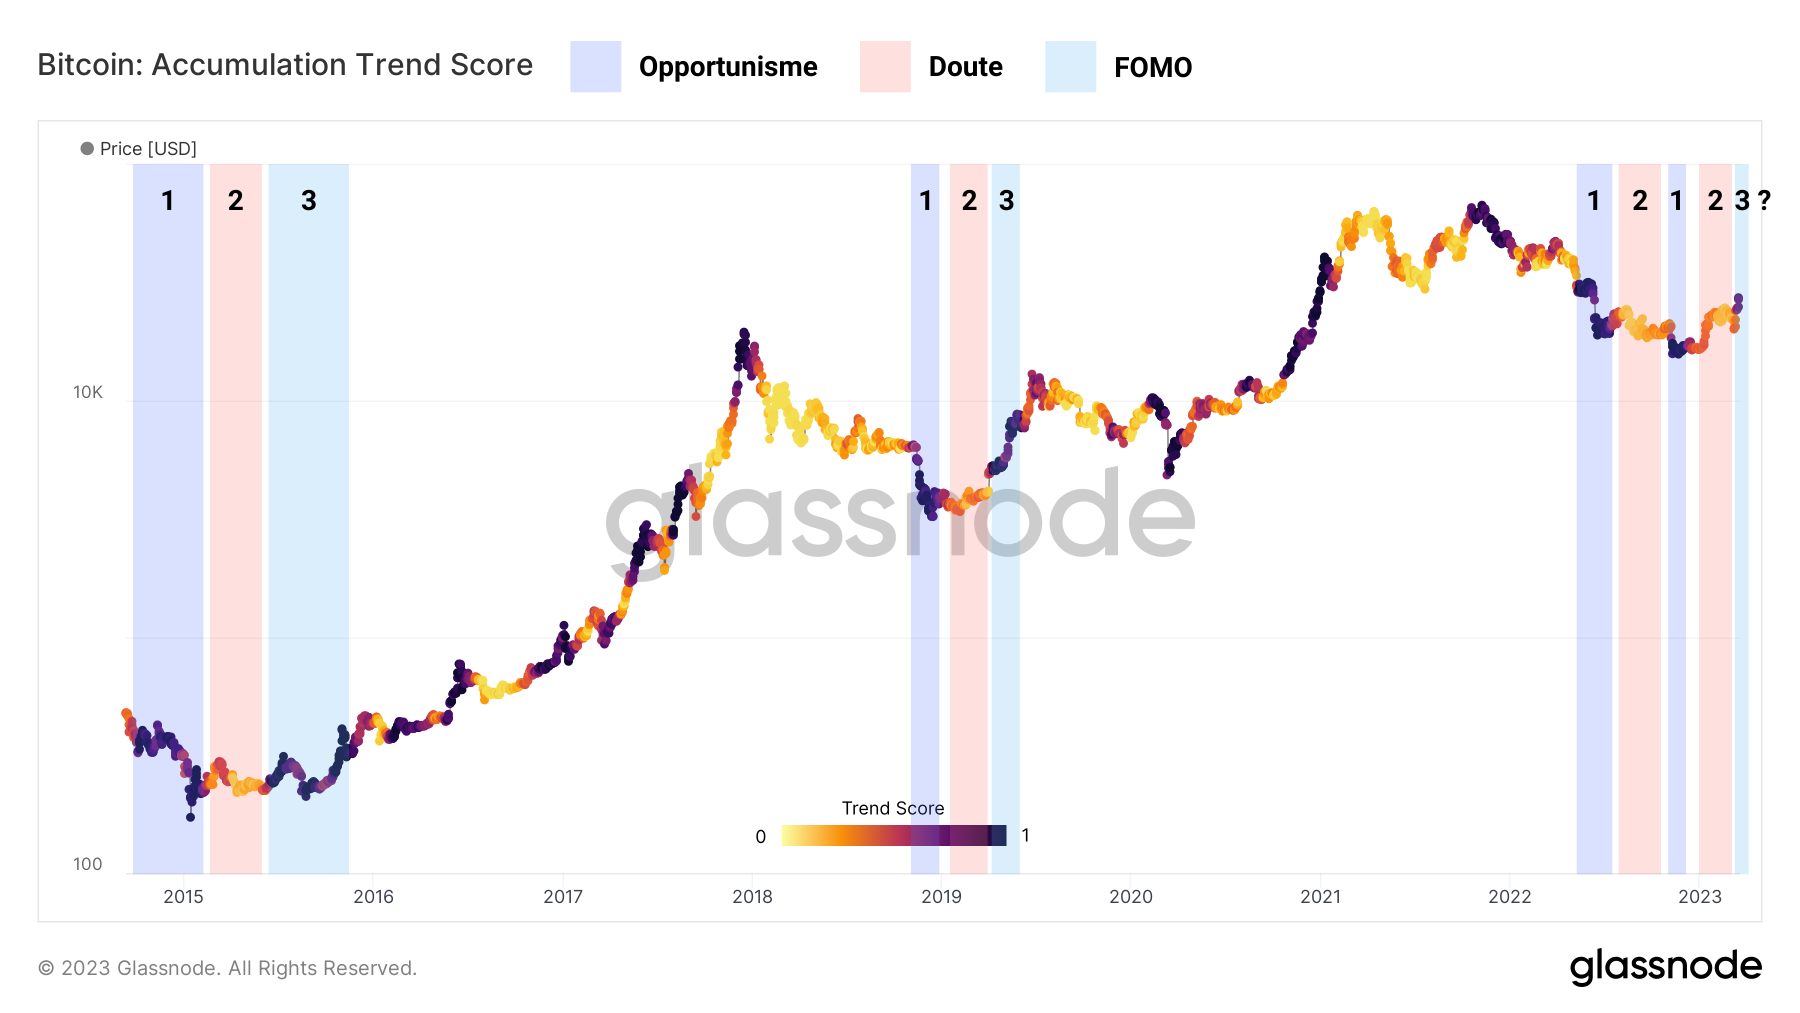
Figure 5: Accumulation trend score
With a score close to 0.8, the indicator below currently measures a strong tendency to hoard on the part of participants holding their BTC outside of exchanges.
BTC’s surge towards $28,000 seems to have caused a move in FOMO palpable, a sign of investor interest.
Finally, this observation is confirmed by the behavioral study of the various slices of entities that make up the market. Indeed, while entities holding more than 10,000 BTC resume their distribution, small hands (holding less than 100 BTC) stop selling and trend towards neutral.
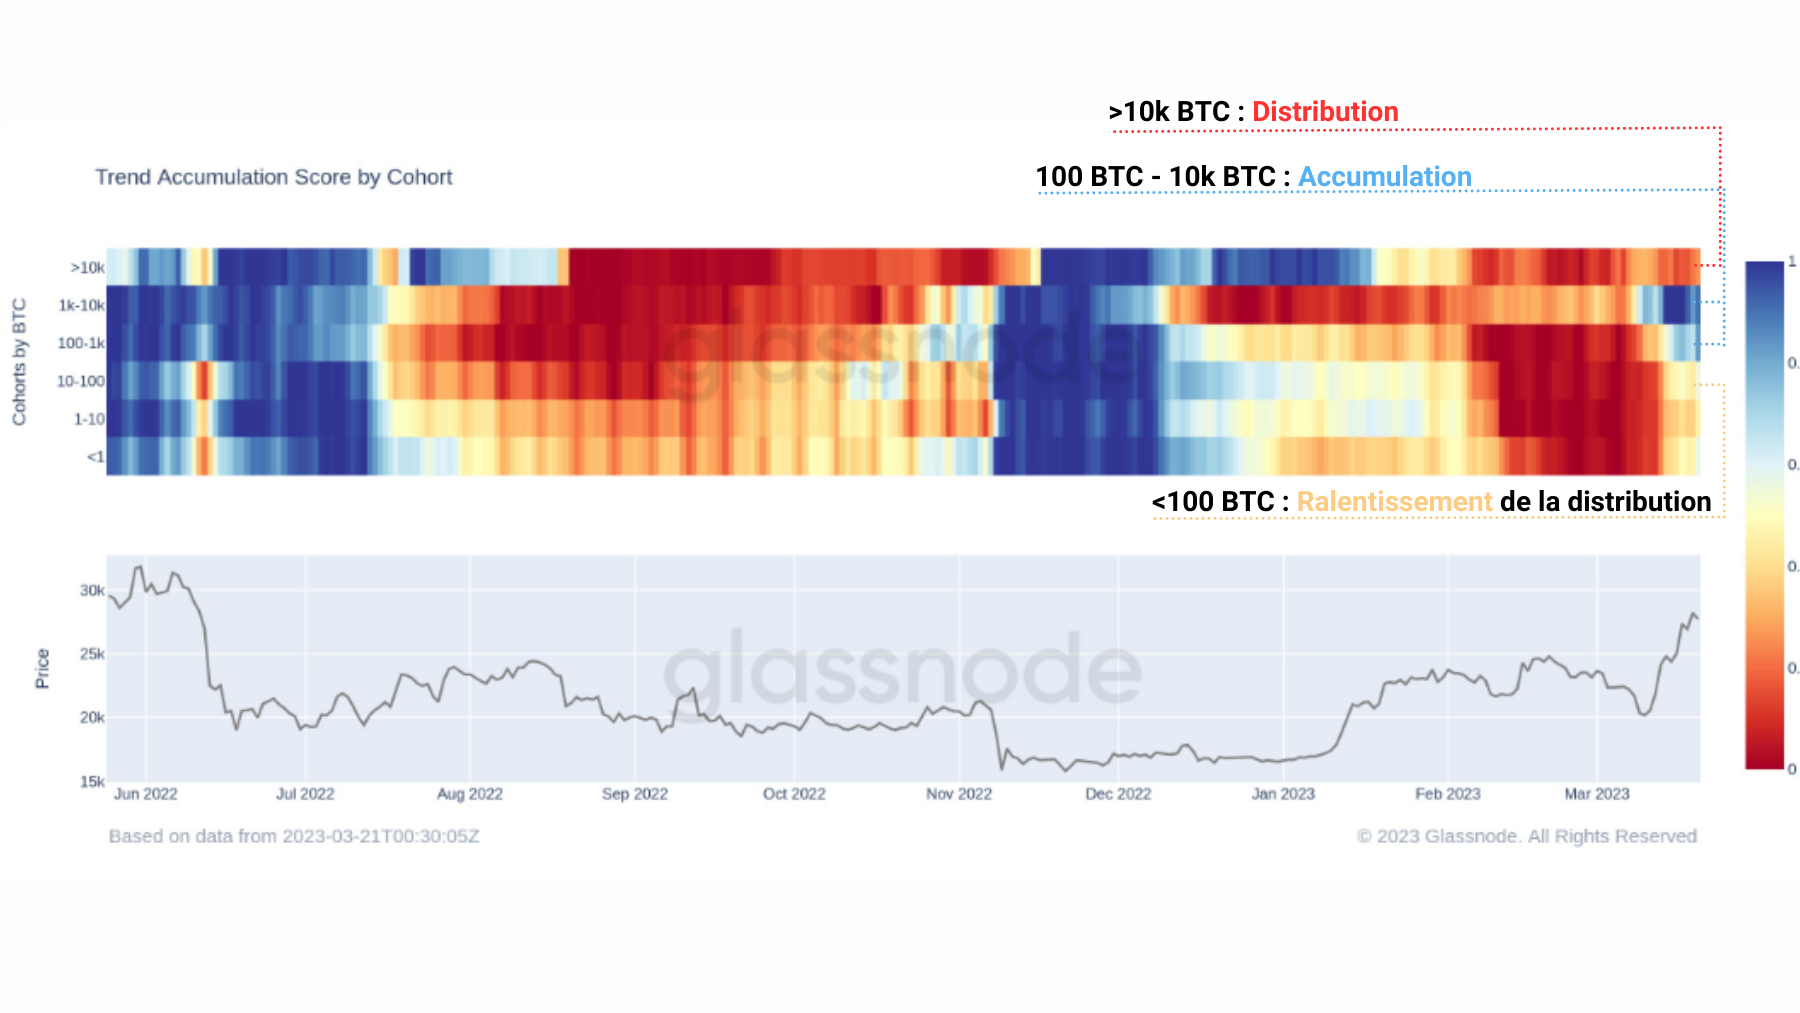
Figure 6: Accumulation trend score, by portfolio cohort
This dynamic is contrasted by a high accumulation of whales (1,000 BTC – 10,000 BTC)recently followed by entities holding between 100 and 1,000 BTC. We can mitigate this observation by pointing out the lack of homogeneity of these behaviors.
Discrepancies are clearly visible and indicate that not all participants share similar biaseswhich can cause an indefinite range period before a consensus appears.
Summary of this on-chain analysis of BTC
Finally, this week’s data suggests that the 2021 – 2022 bear market seems to have ended at the start of 2023. The marked improvement in latent and realized returns, as well as the visible recovery of on-chain activity, indicate that interest and bullish bias are back in the BTC market.
Additionally, recent hoarding behavior signals that some participants anticipate a potential price increase In the coming months.
Nevertheless, it does not mean that the price of BTC will go up in a straight line. Despite a bullish market structure and an optimistic bias, it is better to remain cautious.
Transitions between bear market and bull market can be chaoticdotted with long ranges and periods of extreme volatility. That said, if you’ve held on so far, the worst is behind you.

The leader in DEXs for trading perpetuals
Enjoy 5% off your fees

Sources – Figures 1 to 6: Glassnode
Newsletter
Receive a summary of crypto news every Monday by email
What you need to know about affiliate links. This page presents assets, products or services relating to investments. Some links in this article are affiliated. This means that if you buy a product or register on a site from this article, our partner pays us a commission. This allows us to continue to offer you original and useful content. There is no impact on you and you can even get a bonus by using our links.
Investments in cryptocurrencies are risky. Cryptoast is not responsible for the quality of the products or services presented on this page and could not be held responsible, directly or indirectly, for any damage or loss caused following the use of a good or service highlighted in this article. Investments related to crypto-assets are risky by nature, readers should do their own research before taking any action and only invest within the limits of their financial capabilities. This article does not constitute investment advice.
AMF recommendations. There is no guaranteed high return, a product with high return potential involves high risk. This risk-taking must be in line with your project, your investment horizon and your ability to lose part of this savings. Do not invest if you are not ready to lose all or part of your capital.
To go further, read our Financial Situation, Media Transparency and Legal Notices pages.







;Resize=(1200,627)&hash=8f2900108cf2840812f9499f4aecb259bd07808ffc92007ac686c15e6d576b81)