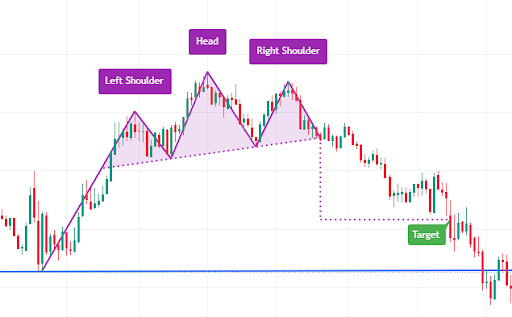
Chart patterns in the online Forex and stock trading are a must-know for any trader. Not only are they beautiful and fun to spot on the charts but they can provide powerful signals to amplify current trading strategy success rate. Many professional traders use chart patterns with fundamentals to trade the markets.
Chart Patterns Simplified
To describe chart patterns simply, when the price moves it sometimes makes different formations that are similar to some figures like butterflies, triangles, flags, etc. These figures sometimes predict future price action trends. Some patterns predict that the price is about to reverse and some provide confirmation for continuation.
Reversals point to the market reversing its trend and are best when used in conjunction with strong fundamentals. Because it is very risky to trade against the trend. When it is a strong trend it could ignore all the technical analysis and mess up traders’ plans. The best time to spot continuation patterns is in the middle of an ongoing trend. In this article, we will try to describe the most popular patterns and how they work. Reversal patterns are a great way to confirm if the market is about to reverse and continuation patterns are best when spotted in the middle of the ongoing trend. A guide to continuation patterns is always handy in detecting them early on the chart.
Which Patterns Are Popular?
Most popular chart patterns include head and shoulders, double top, double bottom, pennants or flags, triangles, etc.

The Head and shoulders pattern is a reversal pattern. There is a good chance that the current trend is gonna reverse if you see this on the chart. Add some other tools to this prediction and the success rate will rise. Not financial advice, though.
Other popular patterns include triangles which occur during the ongoing trend and predict that the price is going to continue in the trend’s direction. There are alternative patterns that are less known to a wide audience of traders but are intriguing and useful to know. Well-known patterns include the Gartley pattern.


The Gartley pattern is a harmony pattern based on Fibonacci numbers. Fibonacci numbers are a common occurrence in nature which adds credibility to the Gartley pattern. Generally, natural tendencies are often repeated in the financial markets as well. Markets move in circles which makes Fibonacci a very useful tool in technical analysis. The Gartley pattern is a complex structure that requires serious training and studying, so be careful not to get frustrated by it. Use other simple patterns for
Pros And Cons Of Using Chart Patterns In Financial Trading
As we mentioned above patterns are great to amplify trading profits but when used alone they can be misleading. The main advantage of pattern trading is that they follow natural laws and market cycles. Financial markets are reflections of these natural patterns and often follow similar cycles.
When used in combination with fundamental analysis of the main economic events and important news, chart patterns have great value. But there is a downside to patterns as well. Sometimes they aren’t exactly as described in books and are hard to spot. Also, traders try to generalize detection rules; it tends to become subjective and different traders may spot the same patterns in different places on the chart. It requires time and lots of practice to memorize more complex chart patterns like head and shoulders, Gartley, flag, etc.
To wrap things up, chart patterns provide great insight into price action and can be used to amplify trading strategy profitability. As with any other indicator in financial markets, they are best when used with other analyses and indicators combined. There is no single indicator to predict the market perfectly. Markets often love to ignore all analysis and research so make sure that you have a good understanding of financial markets before jumping into trading.
Interesting Related Article: “What is Leverage in Financial Trading and How to Use It to Your Advantage?“


