Following the collapse of FTX and the bankruptcy of Alameda Research, the breakout of the $18,000 support plunged many Bitcoin (BTC) holders into an unbearable state of latent loss. Witnessing a historic loss realization, November 2022 marks the formation of a new bear market floor at the $16,000 level, the robustness of which remains to be tested. Here is the on-chain analysis of the Bitcoin situation.
A second bottom is forming for Bitcoin
Bitcoin (BTC) price stumbles on the $17,000 level, merging with its 20-period moving average.
Following the collapse of FTX and the bankruptcy of Alameda Research, the breakout of the $18,000 support sent many BTC holders into a state of loss unbearable latent.
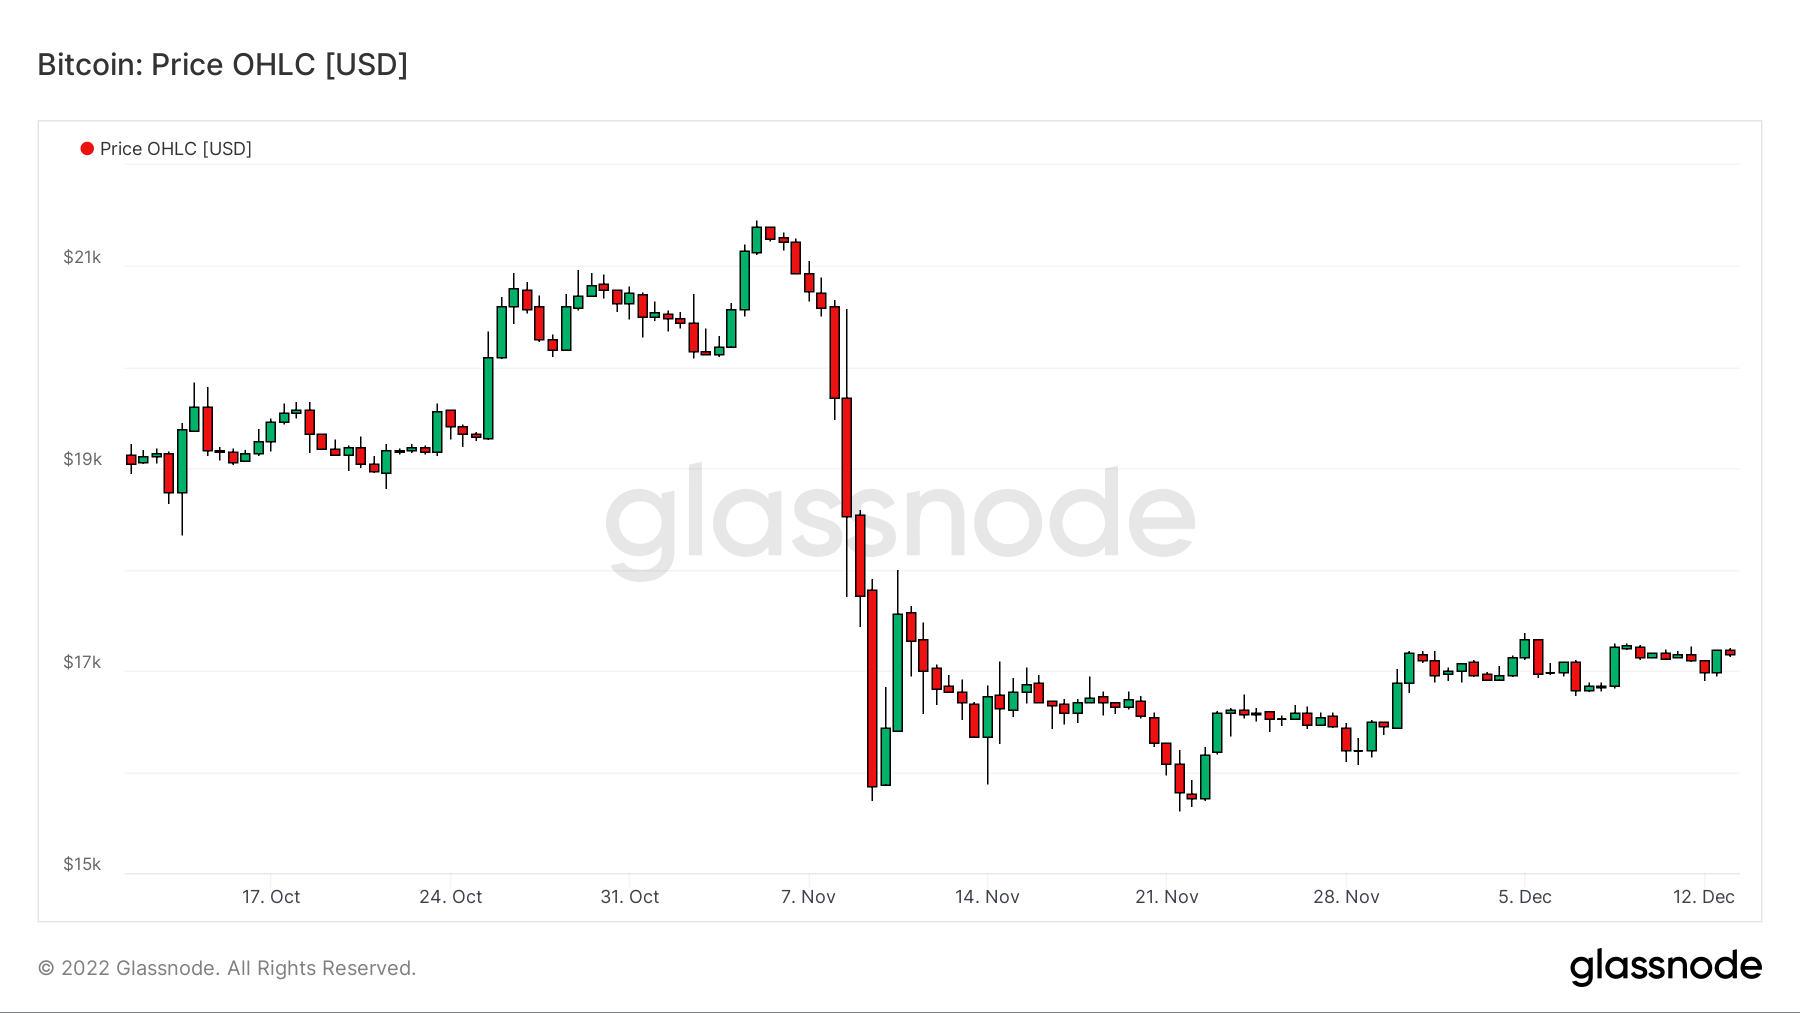
Figure 1: Daily price of BTC
In response to this pressure, part of the cohort of long-term holders (LTH)as well as some minors liquidated part of their assets and caused a redistribution of the supply of BTC to lower price levels.
Recording a realization of historic lossthe month of November 2022 marks the formation of a new bear market floor at the $16,000 levelwhose robustness remains to be tested.

Prof Chaîne intervenes every week on our Premium Group

A redistribution of BTC supply
In order to observe how the price of BTC caused a migration of the circulating supply to a new price range, we will study the URPD, or Distribution of Realized UTXO Prices.
This graph in the form of a histogram represents the assumed acquisition prices of all UTXOs circulating on the Bitcoin networkoffering insight into the basic cost breakdown of BTC holders.
In the week leading up to the fall of FTX, it can be noticed that the BTC spot price was just above a sizeable realized price volume (in blue) whose bearish crossing was likely to cause a significant loss.
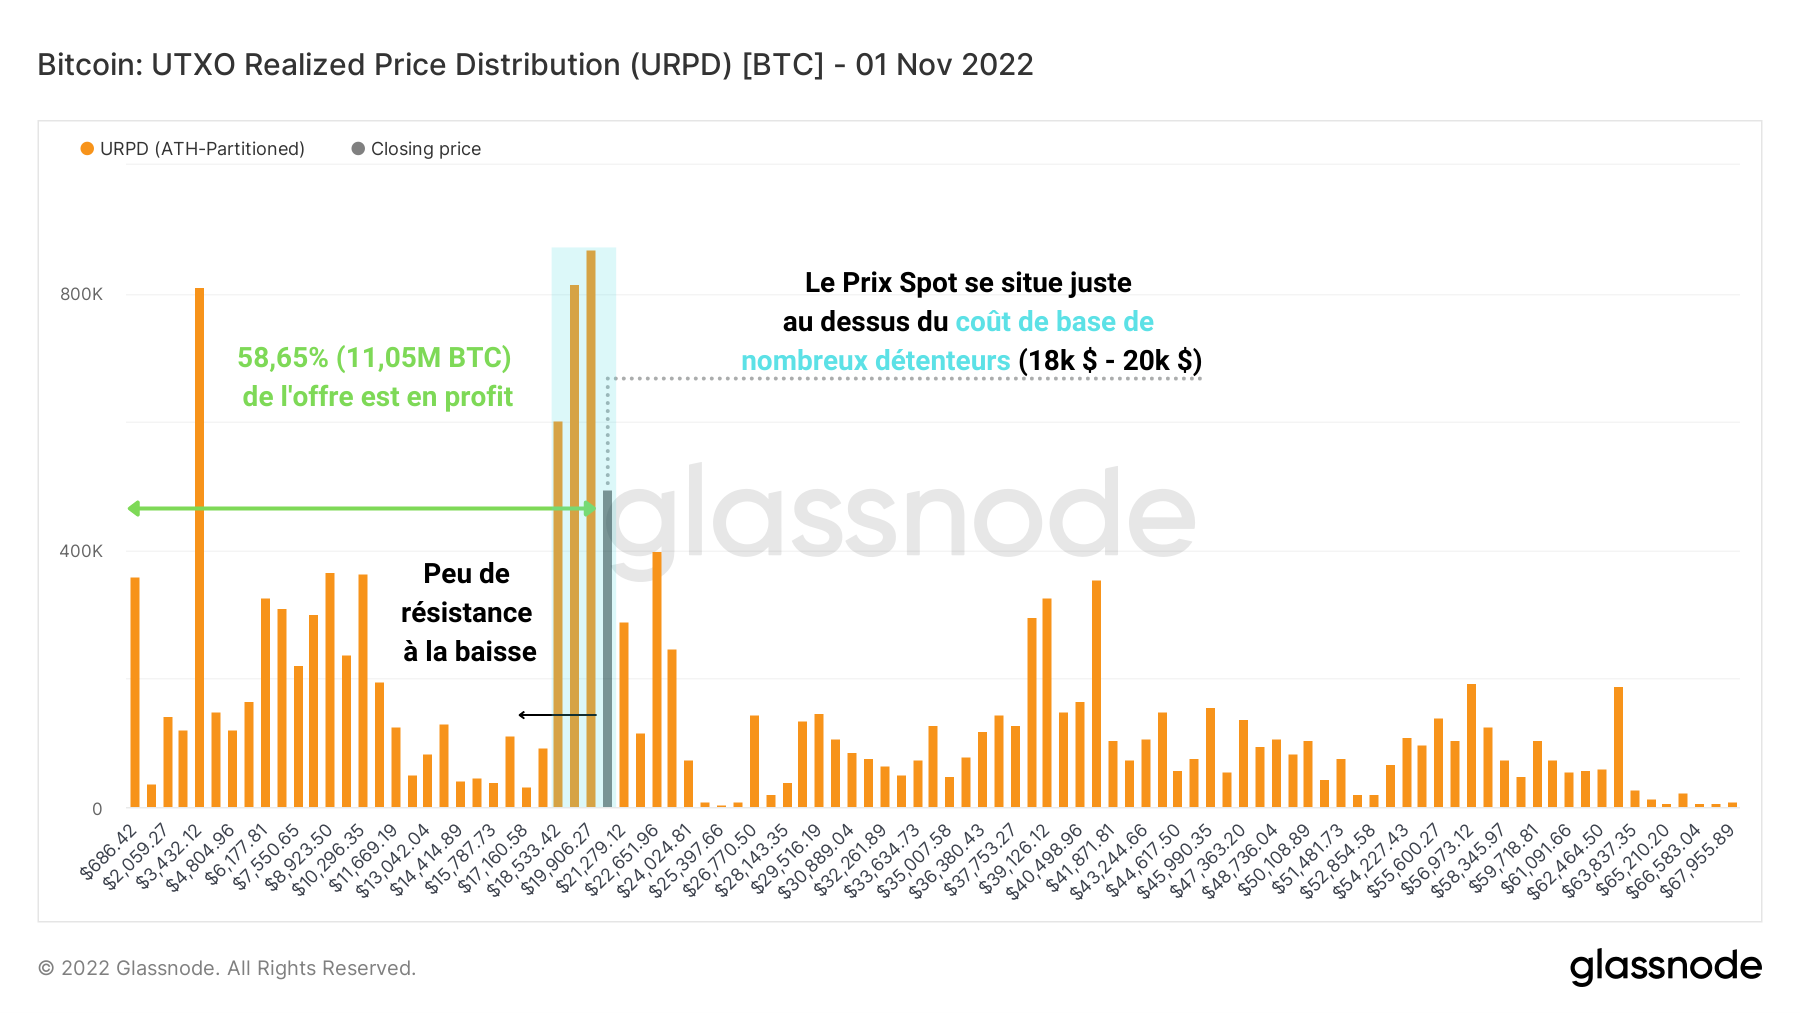

Figure 2: UTXO Realized Price Distribution (November 1, 2022)
At this time, just under 60% of the circulating BTC supply was in a state of latent profit, which was still quite high considering the late stage of the bear cycle.
A week after the fall in price, we could observe a decrease in supply concentration between $18,000 and $20,000which gradually migrated towards the $16,400 level, where nearly 5% of the circulating supply was then.
The fact that the price of BTC dipped below $18,000 obviously caused a bearish redistribution of BTC held at a lossso that a change in ownership takes place at the new bear market low.
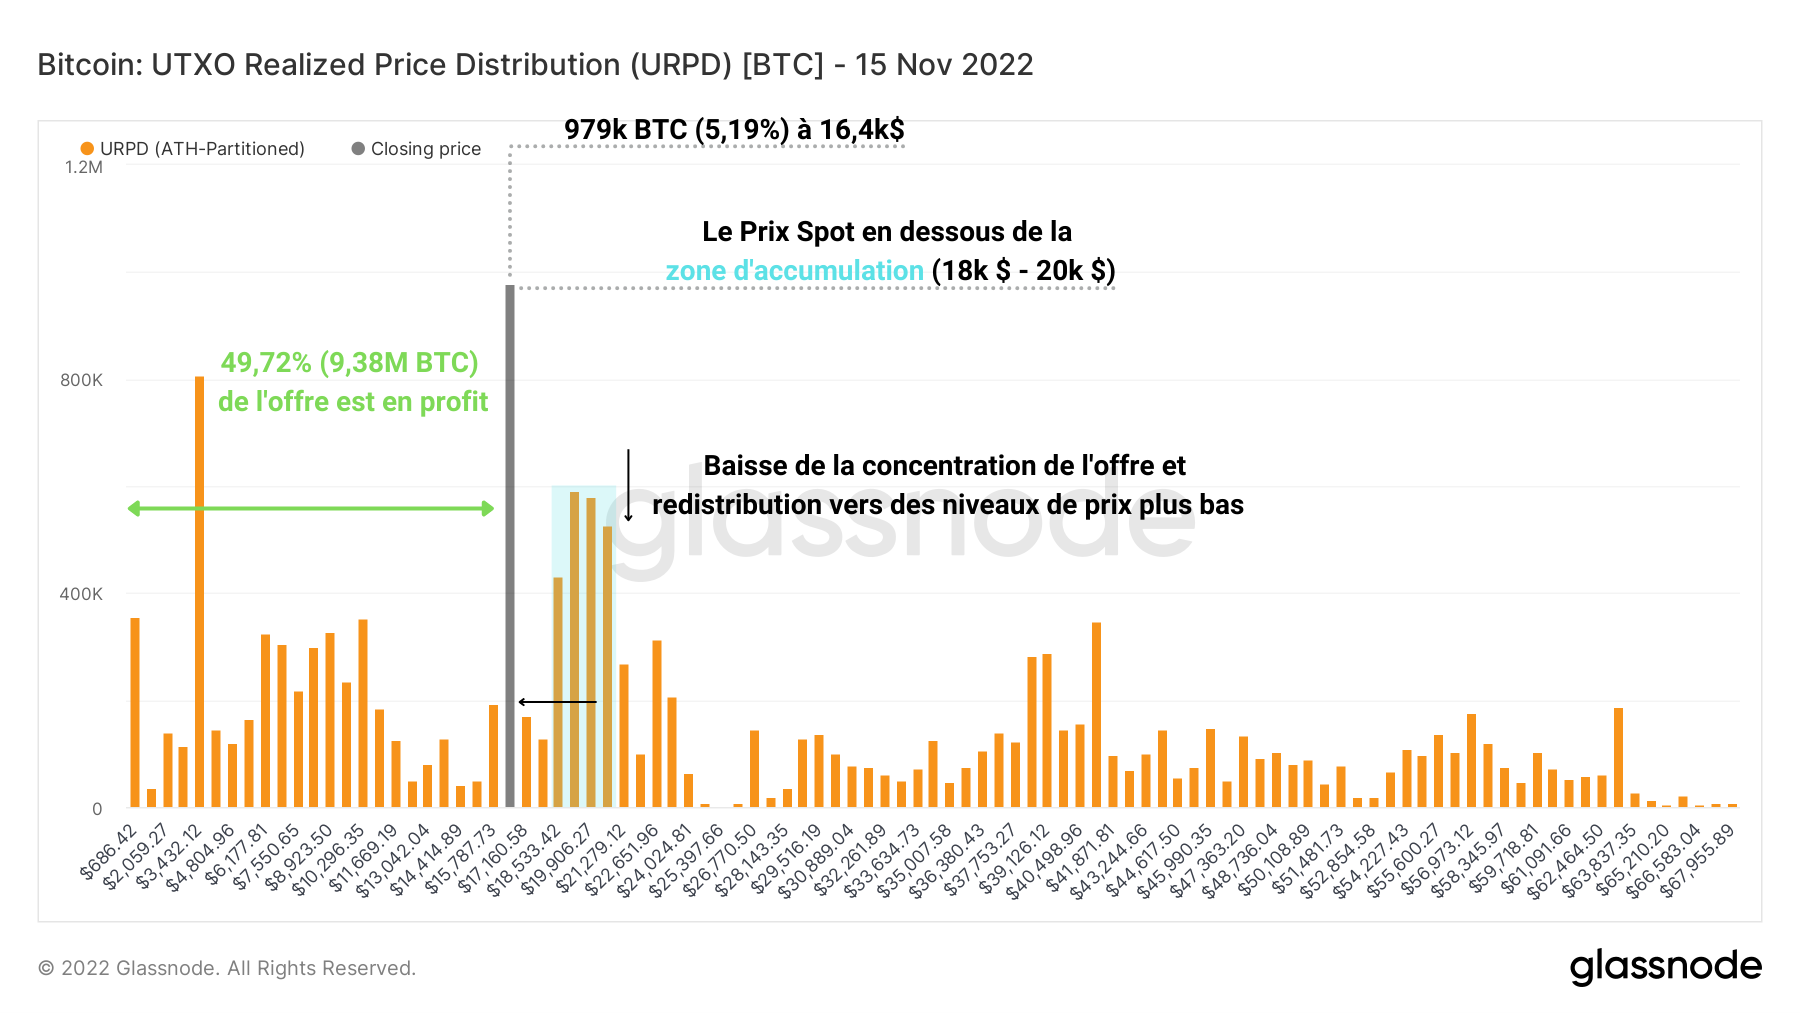

Figure 3: UTXO Realized Price Distribution (November 15, 2022)
During this period, the majority of the outstanding supply (50.28%) was in loss, signaling a sharp drop in profitability of the entire market that only occurs during the most painful periods of bear cycles.
At present, the former accumulation zone has been transformed into a potential distribution zone (in red), which can hinder bullish momentum in the price of BTC.
Indeed, the BTCs still held at a loss in this price range have significant probabilities of selling which could occur when the price comes to test this zone on the rise.
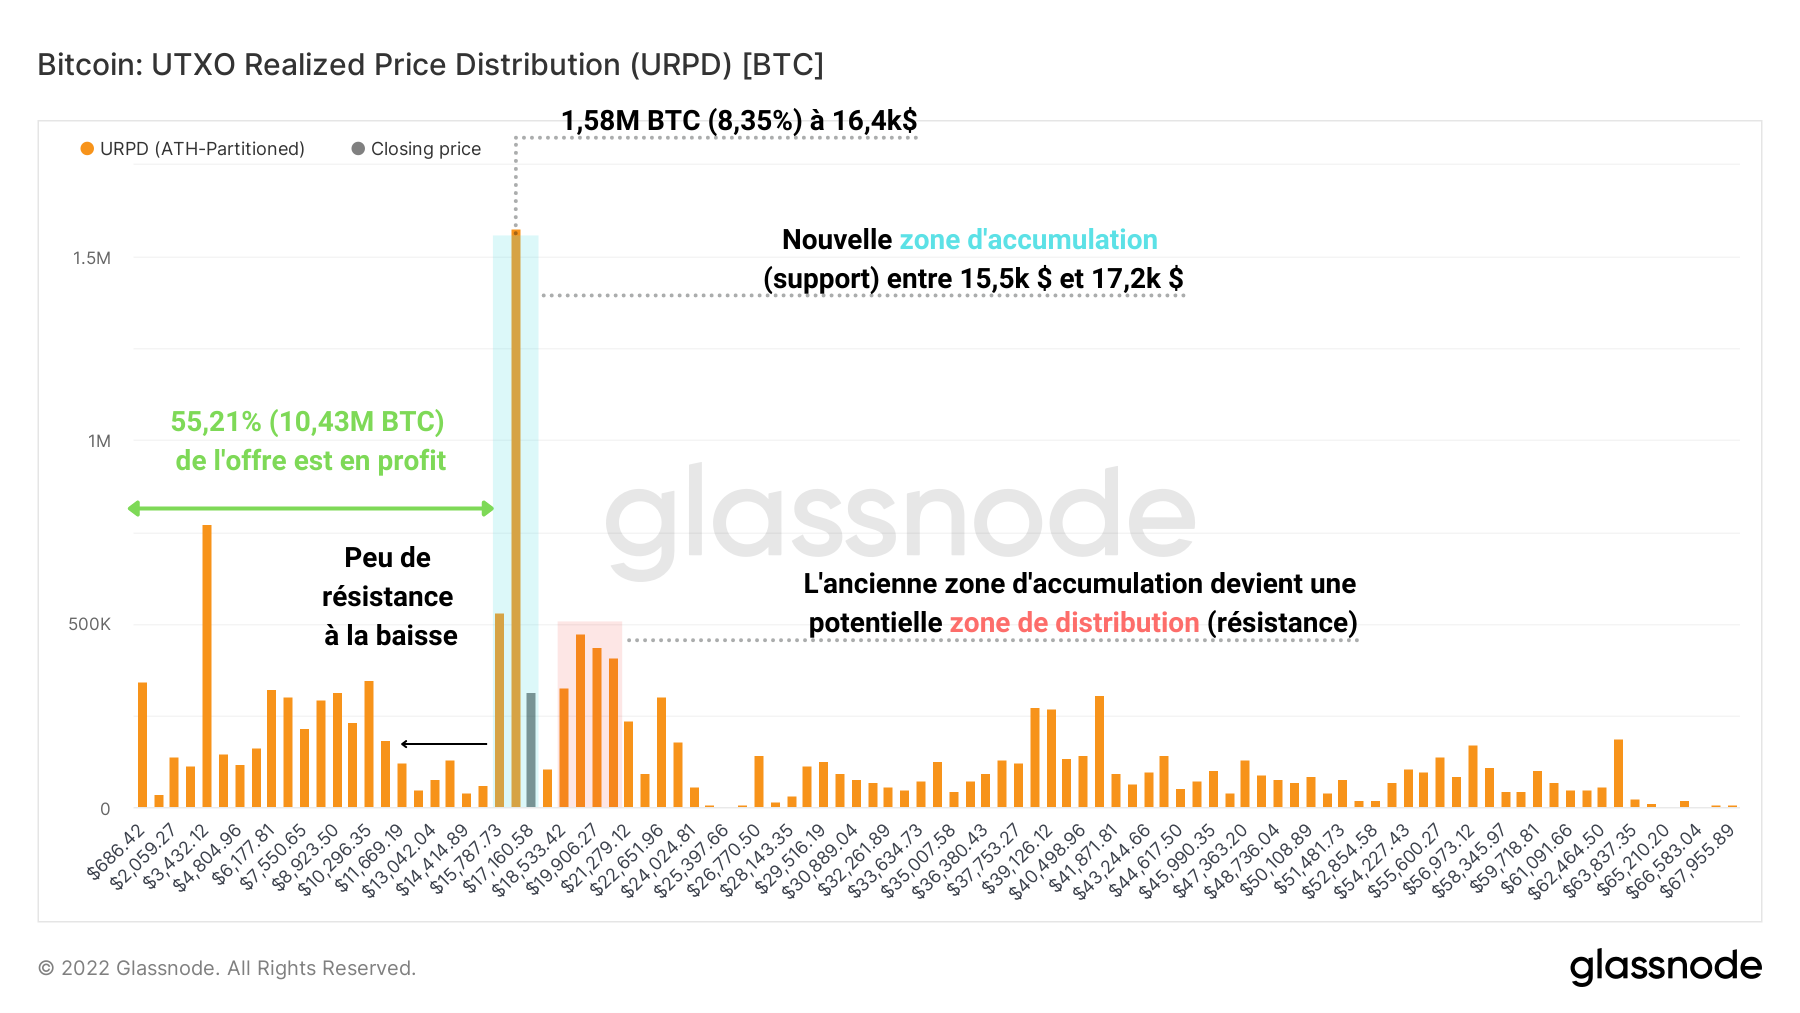

Figure 4: UTXO Realized Price Distribution (December 13, 2022)
For now, a new accumulation zone, which can serve as support for the price, is being formed between $15,500 and $17,200 (in blue), concentrating today more than 8% of the supply in circulation.
Holders who have accumulated in this price range are today smoldering a slight gain, pushing the offer up in profit status towards 55.21%

Bitcoin supports and resistances to watch
After having identified a new potential support zone for the price of BTC, the lower limit of which is approximately between $15,500 and $16,000, we can consult the on-chain pricing models presented a month ago in order to establish participants’ areas of interest.
Overall, the conclusion remains essentially the same: the price of BTC, being in the undervaluation zone since it went below the realized price (in orange), is moving above the balanced price (in green)which acted as support during the breakout of $18,000.
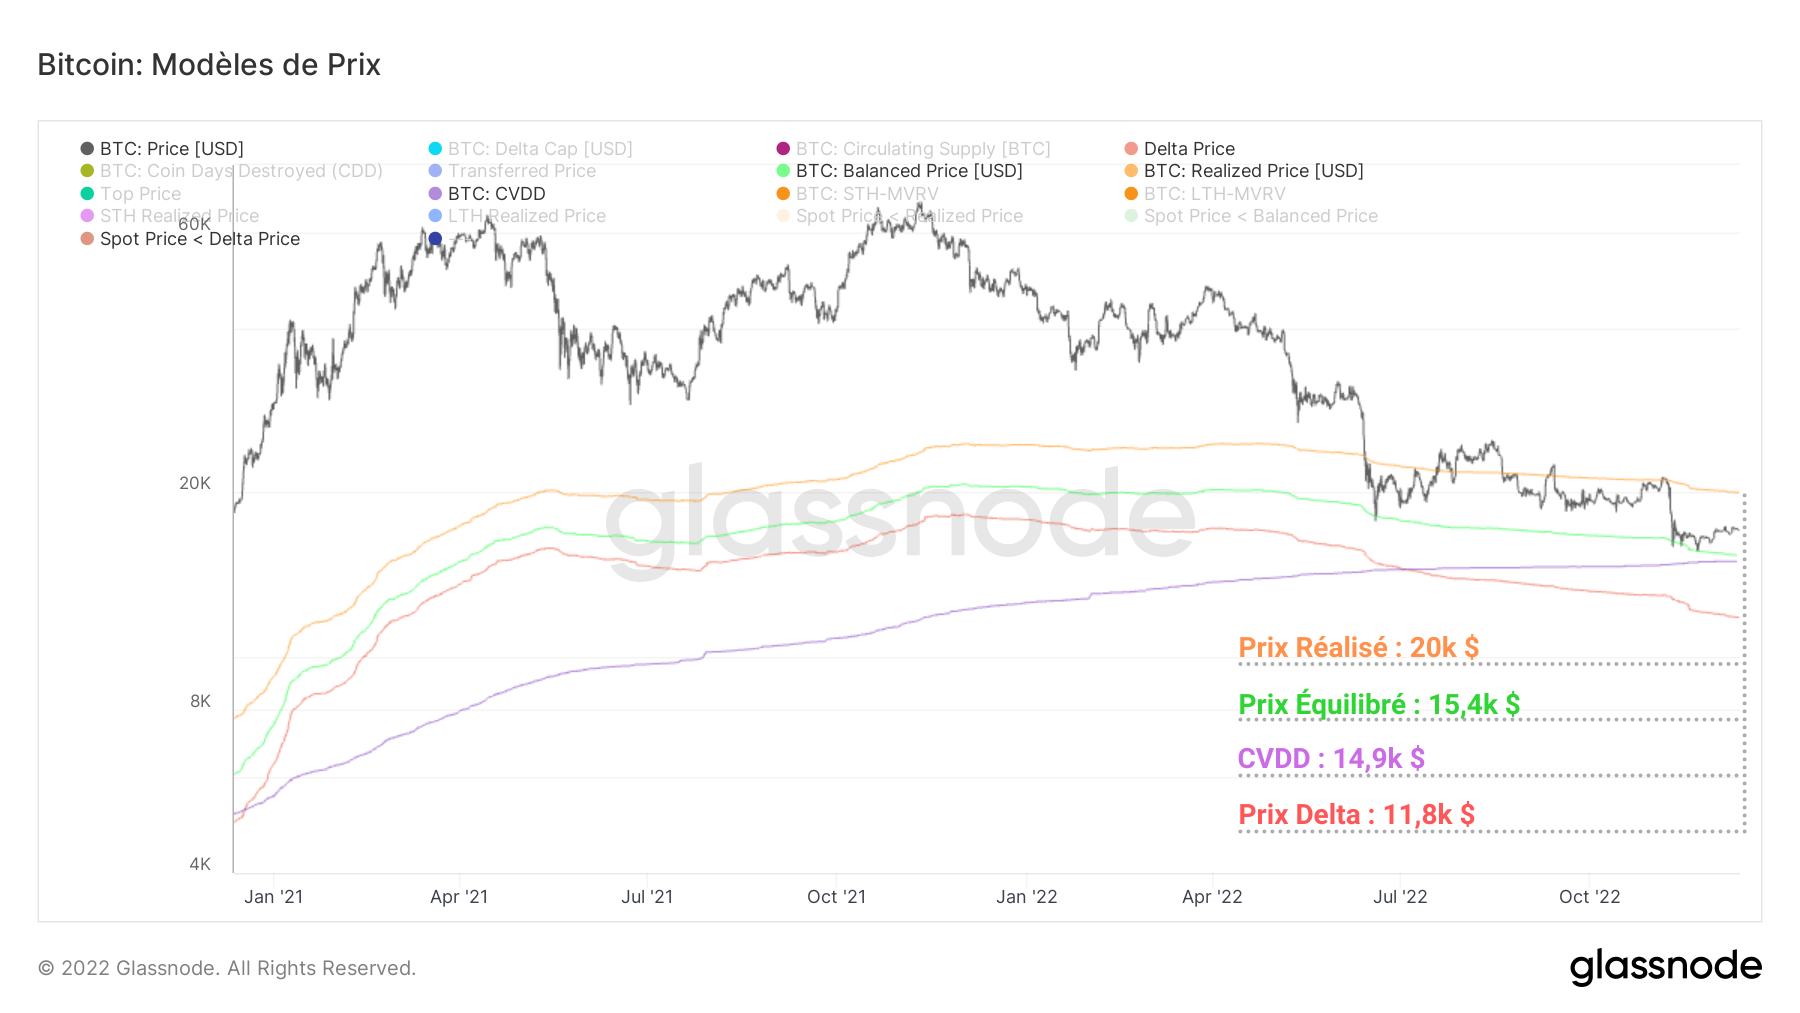

Figure 5: Realized Price, Balanced Price, CVDD and Delta Price
With a convergence of the CVDD (in purple), the balanced price and the new accumulation zone mentioned above, it looks like the price range between $15,000 and $16,000 can provide robust support in the event of a drop in the spot price.
However, if this price zone were to be invalidated downwards, the delta price (in red), located near 12,000 dollars, represents the ultimate support which coincided with the final wicks of all previous bearish cycles.
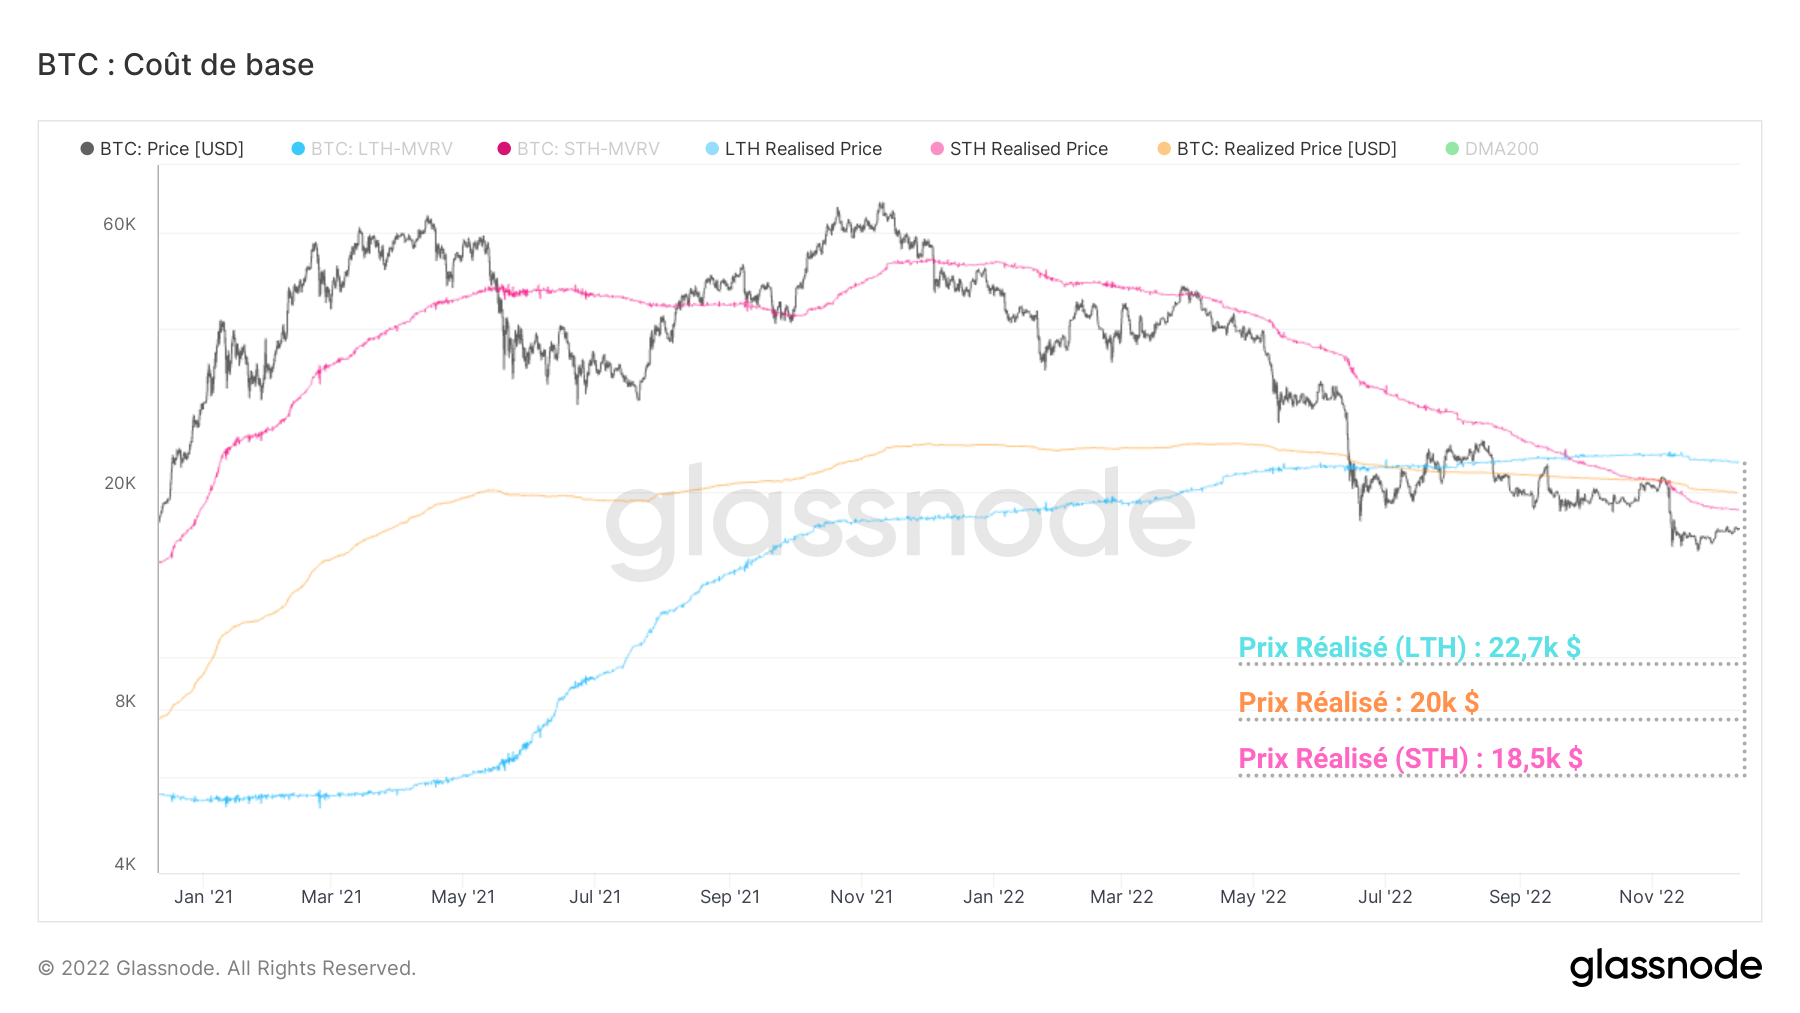

Figure 6: Realized Market and Entity Price (STH/LTH)
If we look at the optimistic scenario of a bullish recovery, the resistance levels that can hinder the price of BTC are:
- The realized price of STH ($18,500) : coinciding with the former accumulation zone, this price level represents a supply zone where many holders could sell as soon as the profitability of their position becomes neutral again;
- The Realized Price (~$20,000) : representing the cost base of the average investor, this price pattern marks the border between the undervaluation and the overvaluation of the BTC spot price;
- The realized price of LTHs ($22,700) : measuring the base cost of long-term holders, this indicator is the last threshold that the price will have to overcome to signal a return to profitability for all cohorts of BTC holders.

Trade on the leading DEX


Summary of this on-chain analysis of BTC
In sum, this week’s data tells us that a new bearish redistribution of supply has taken place following the break of the support at $18,000.
A new accumulation zone, located at the $16,000 level, currently concentrates almost 8% of the circulating supply and constitutes, with the convergence of the balanced price and the CVDD towards $15,000, a second bear market floor whose robustness remains to be tested.
Conversely, the old demand zone ($18,000 – $20,000) now coincides after the base cost of short-term holders and represents a potential obstacle to the bullish recovery of the price of BTC.

Prof Chaîne intervenes every week on our Premium Group


Sources – Figures 1 to 6: Glassnode
Newsletter
Receive a summary of crypto news every Monday by email
What you need to know about affiliate links. This page presents assets, products or services relating to investments. Some links in this article are affiliated. This means that if you buy a product or register on a site from this article, our partner pays us a commission. This allows us to continue to offer you original and useful content. There is no impact on you and you can even get a bonus by using our links.
Investments in cryptocurrencies are risky. Cryptoast is not responsible for the quality of the products or services presented on this page and could not be held responsible, directly or indirectly, for any damage or loss caused following the use of a good or service highlighted in this article. Investments related to crypto-assets are risky by nature, readers should do their own research before taking any action and only invest within the limits of their financial capabilities. This article does not constitute investment advice.
AMF recommendations. There is no guaranteed high return, a product with high return potential involves high risk. This risk-taking must be in line with your project, your investment horizon and your ability to lose part of this savings. Do not invest if you are not prepared to lose all or part of your capital.
To go further, read our Financial Situation, Media Transparency and Legal Notices pages.


