The distribution behavior intensified, with the price of Bitcoin (BTC) reaching the key level of $20,000 before making a strong rebound towards $26,000. The recent drop in price did not leave indifferent market participants, especially long-term holders, who realized heavy losses. On-chain analysis of the situation.
Bitcoin bounces off $20,000
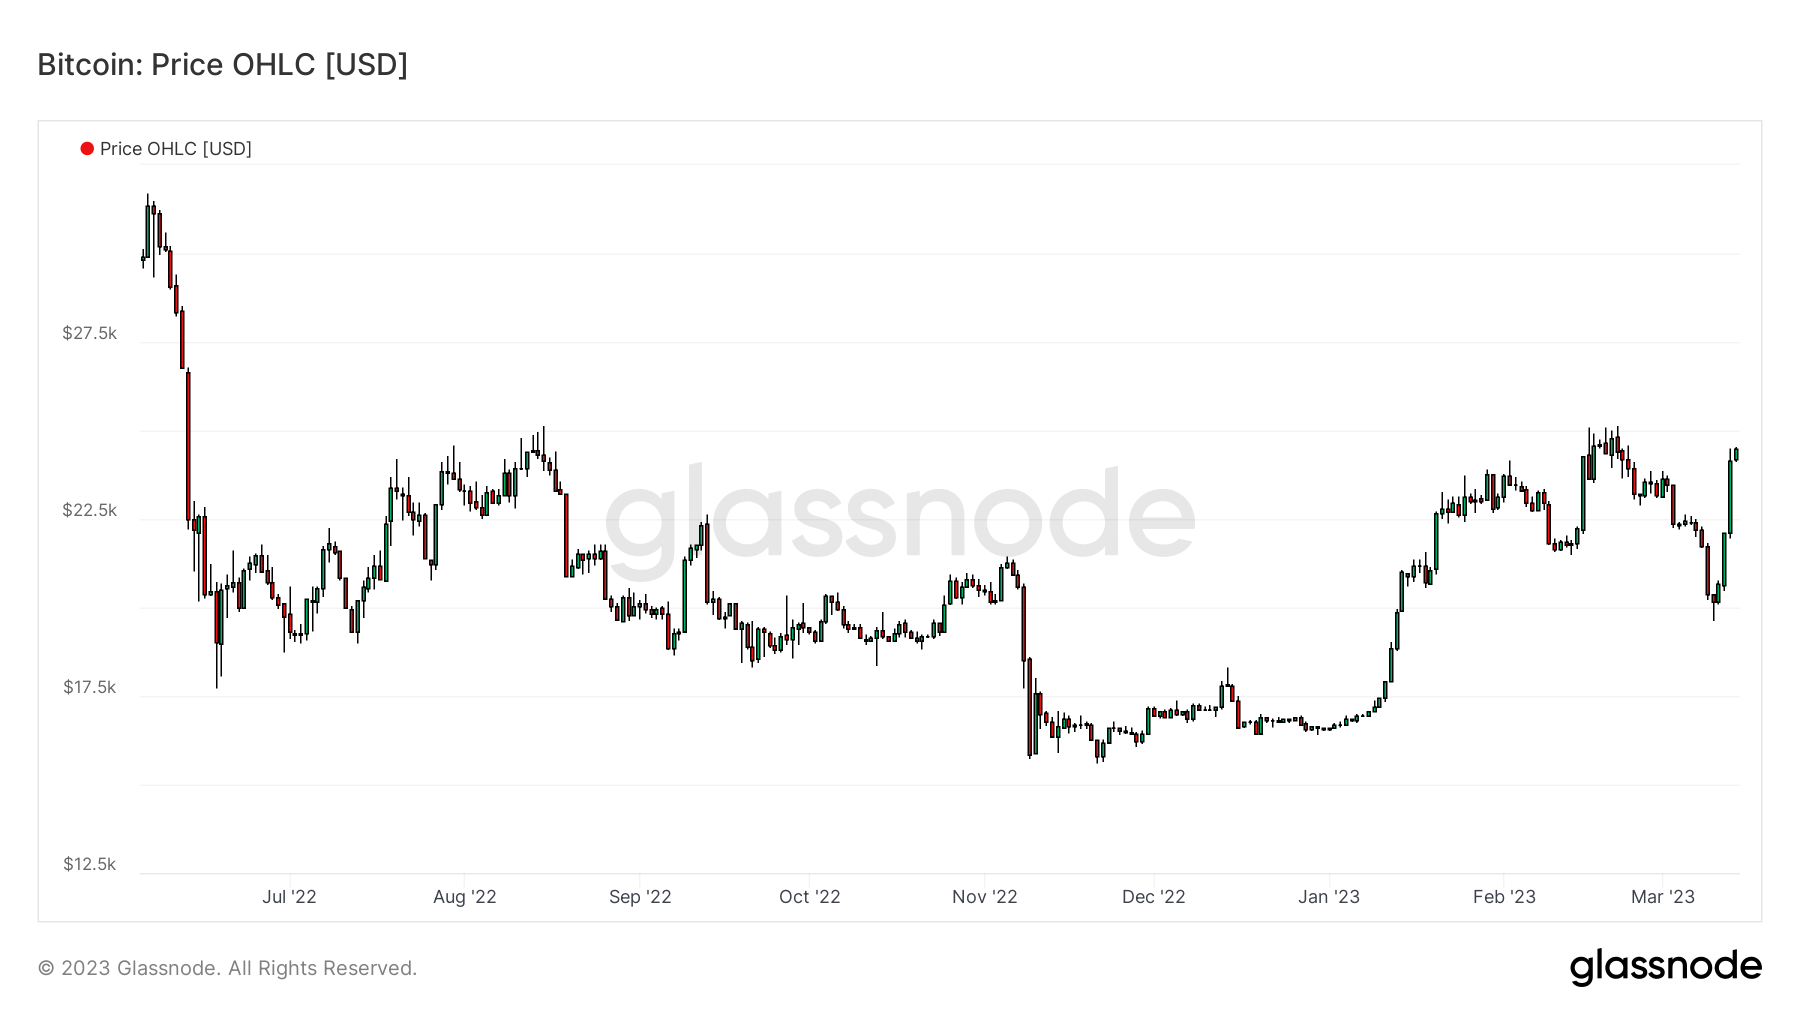
The distribution behavior described two weeks ago has intensified, Bitcoin (BTC) price hitting the key $20,000 level before making a strong rebound towards $26,000.
The recent drop in the price did not leave market participants indifferent, especially long-term holders. The latter have clearly suffered from the fall of the market, realizing colossal losses on occasion.
This week, we continue the behavioral analysis of our previous edition with the last minute data offered to us by the BTC market.

Figure 1: Daily price of BTC

Take your investments to the next level with the analyzes of Prof Chaîne

Base costs act as support
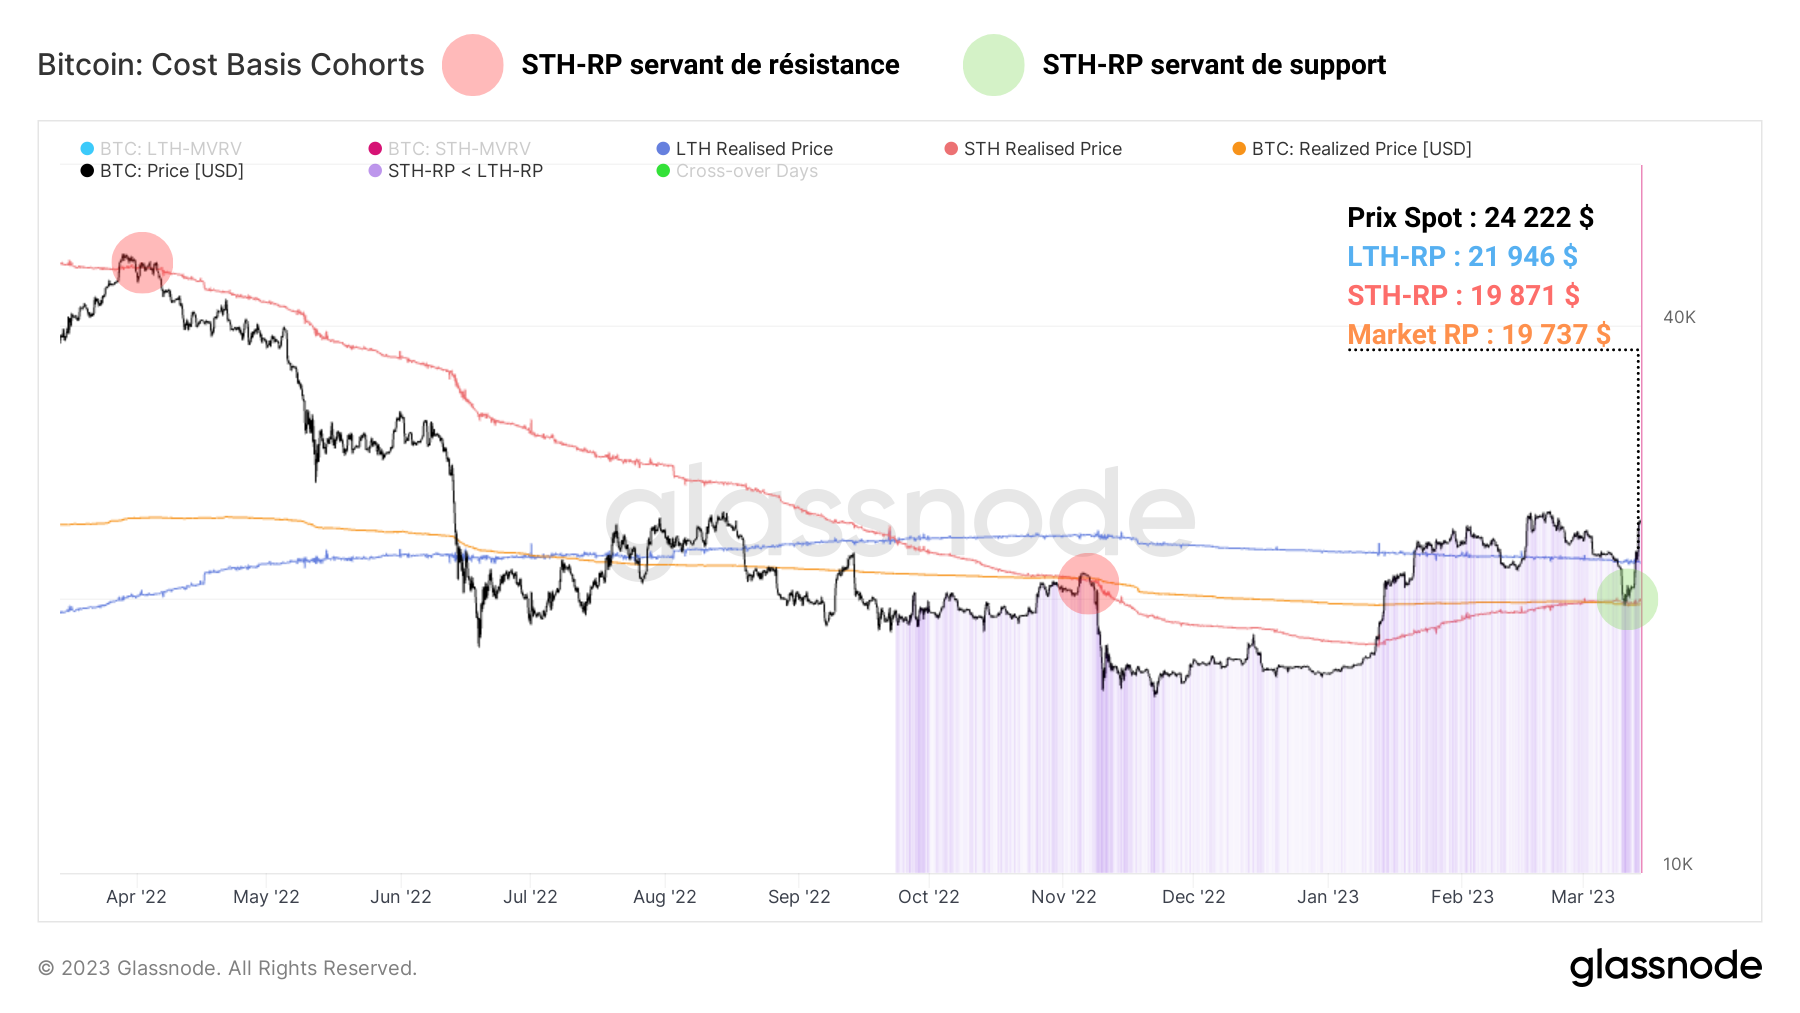
Looking at the relationships between spot price and base costs for various participant groups over the past year, something jumps out. The Average Short-Term Holders Base Cost (STH-RP) has tended to act as resistance to the spot price throughout the 2022 bear market.
However, since breaking free from it in early 2023, this on-chain level seems to be supporting the spot price.as seen in recent price action.
This signals a key change in behavior: short-term holders, rather than selling close to their cost basis to limit risk, tend to accumulate close to it and “double down”. Such behavior indicates that the bullish bias remains largely favored and that the decline had little impact on this cohort.

Figure 2: Realized market, STH and LTH price

The No. 1 exchange in the world – Regulated in France
10% off your fees with code SVULQ98B

Long-term holders loss taking
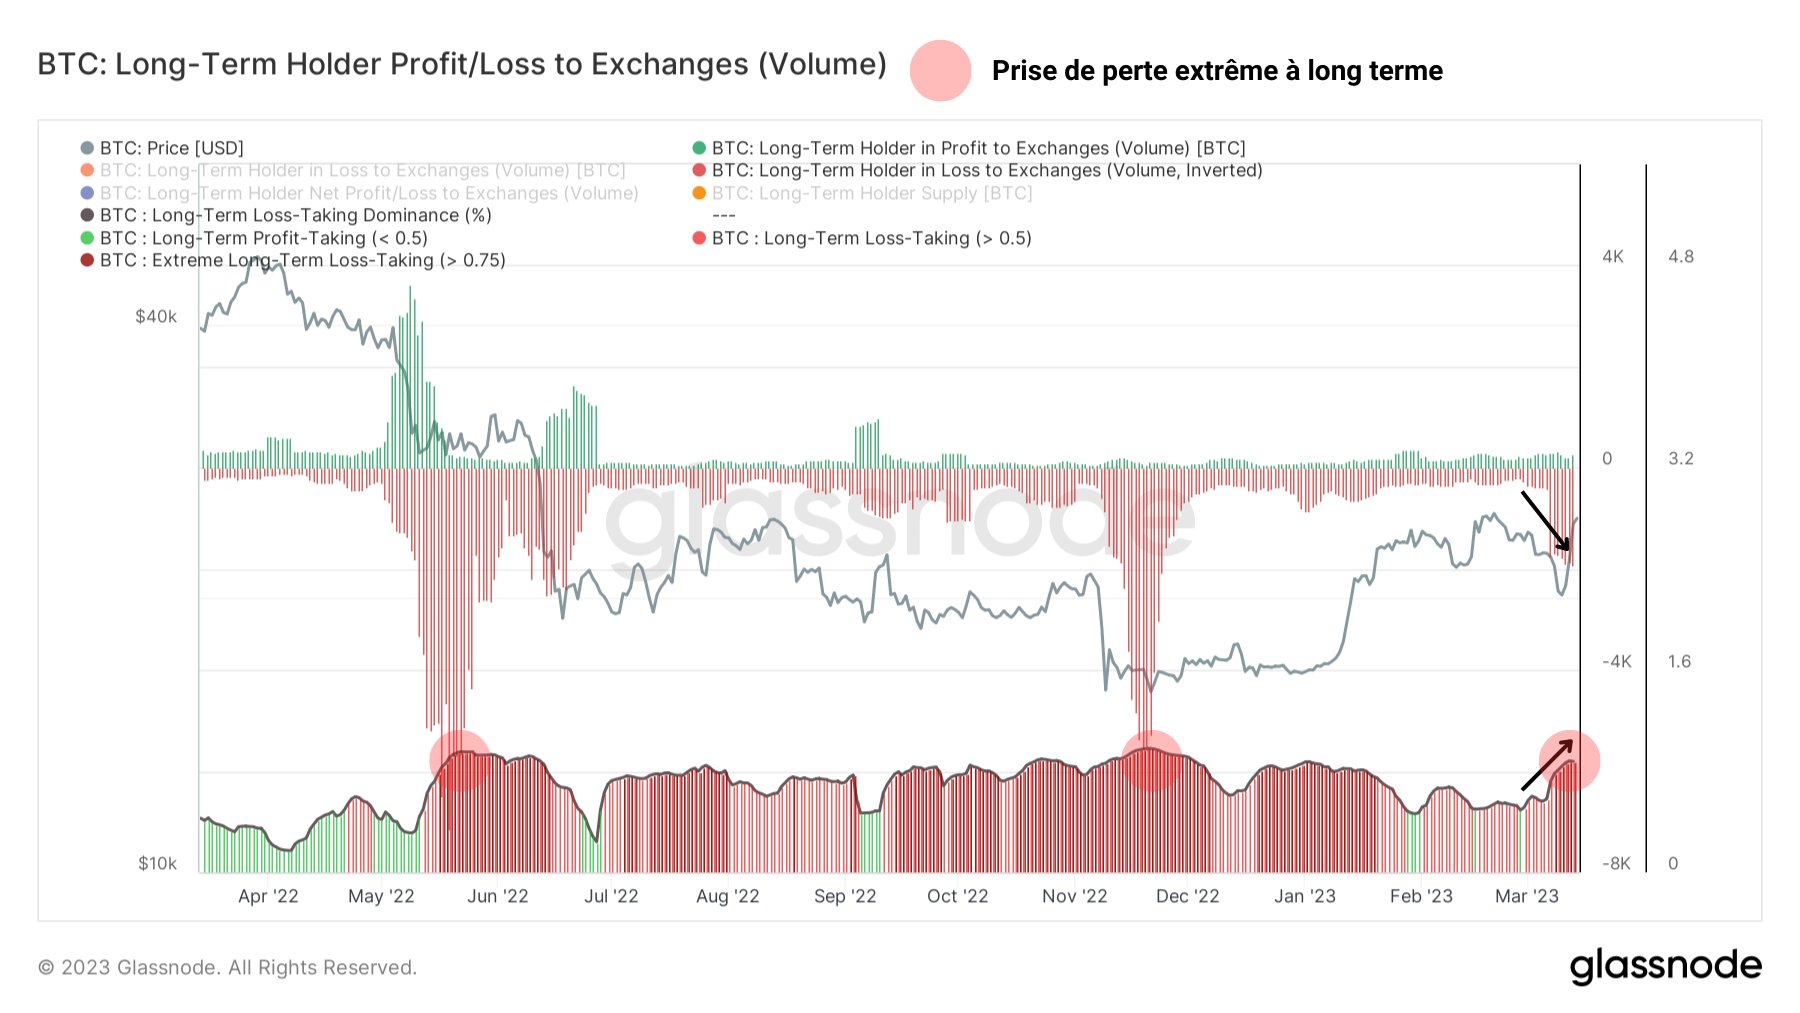
On the side of the long-term holders (LTH), the selling behavior has manifested itself in a pronounced way and just starting to slow down. Indeed, the loss volumes sent daily to the exchanges increase, going from 400 BTC to 1,600 BTC between March 8 and 9 and then to 1,800 BTC over the weekend.
By measuring the ratio between loss and profit volumes, we can gauge the dominance of STH take-loss via the oscillator at the bottom of the chart. VSe last indicates once more a state of loss extreme (dominance > 0.75)while the LTH cohort struggles to regain a bullish bias.
Market ends are periods of increasing risk for members of this cohort, who tend to run out of steam and make large losses as time goes by, despite initially strong conviction.
note that the conviction of some long-term holders may also have been shaken by the recent news concerning the bankruptcies of the Silvergate and SVB banksauguring a very risky contagion for the traditional financial sector.

Figure 3: LTH profit/loss volume to exchanges
Generally, the LTH cohort is still making significant losses, between -10% and -20%. Despite a noticeable improvement in their realized profitability, from -50% to almost -20% between November 2022 and March 2023, few long-term holders are currently taking profits.
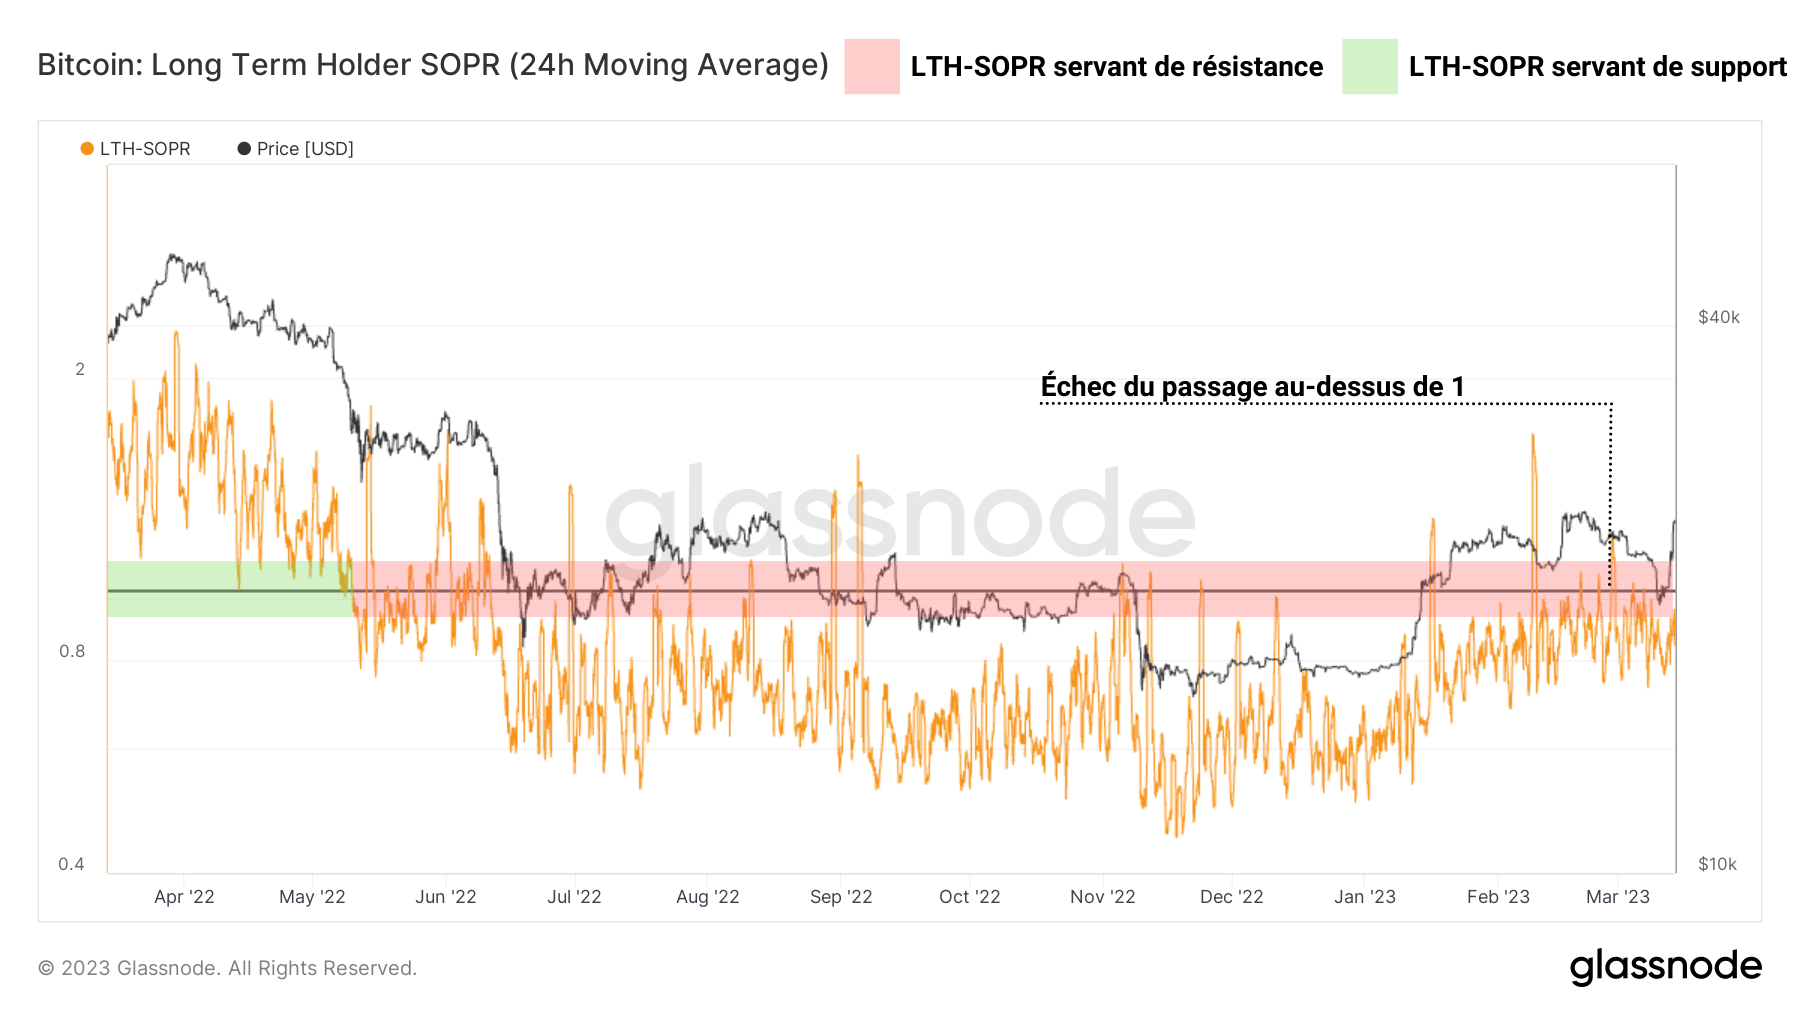
This is also visible via the LTH-SOPR, which measures the profitability of spent UTXOs that are older than 155 days. This indicator provides great insight into the long-term directional bias of the marketthe neutral zone (LTH-SOPR =1) serving as the border between the bullish and bearish biases.
The failure of the LTH-SOPR to cross above 1 perfectly illustrates this difficulty of the LTHs to switch to profit takingwhile many of them are again above their break-even point (around $22,000).
While the price had climbed above this threshold for most of February, its relapse, albeit temporary, manifested significant loss taking in LTH. In order to signal the return of a long-term bullish bias, the LTH-SOPR will have to climb permanently above the neutral zone (LTH-SOPR = 1) and use it as support.

Figure 4: LTH-SOPR
This selling behavior is supported by the data in the following chart. The age bands of the volumes of BTC spent measure the relative share of the volume of expenditure of a given age group compared to the total daily volume.
By selecting volumes that are 6 months or older, referred to as ‘legacy’, we can target the spending behavior of long-term holders and observe their reaction to market fluctuations. What emerges from the study of the most recent data of this metric is that volumes of old books have indeed been spent, in an increasing manner, from the end of February.
This spending peaked on March 7, just before the price fell below $22,000, representing more than 10% of total transfer volume at that time.

Figure 5: Age bands of volumes spent

Summary of this on-chain analysis of BTC
Finally, this week’s data suggests that BTC’s recent price rally towards $20,000 offered market participants a significant test of conviction.
On the side of the long-term holders, a substantial loss taking took placeinvolving older BTCs becoming less profitable as BTC slid over their average base price, located around $22,000.
The failure of the LTH-SOPR to cross above 1 illustrates the difficulty for LTHs to transition into profit taking, with the cohort still making losses of between -10% and -20%.
It’s a safe bet that this distribution was absorbed by strong demand at the $20,000 level.led by whales and part of the STH.

The leader in DEXs for trading perpetuals
Enjoy 5% off your fees

Sources – Figures 1 to 5: Glassnode
Newsletter
Receive a summary of crypto news every Monday by email
What you need to know about affiliate links. This page presents assets, products or services relating to investments. Some links in this article are affiliated. This means that if you buy a product or register on a site from this article, our partner pays us a commission. This allows us to continue to offer you original and useful content. There is no impact on you and you can even get a bonus by using our links.
Investments in cryptocurrencies are risky. Cryptoast is not responsible for the quality of the products or services presented on this page and could not be held responsible, directly or indirectly, for any damage or loss caused following the use of a good or service highlighted in this article. Investments related to crypto-assets are risky by nature, readers should do their own research before taking any action and only invest within the limits of their financial capabilities. This article does not constitute investment advice.
AMF recommendations. There is no guaranteed high return, a product with high return potential involves high risk. This risk-taking must be in line with your project, your investment horizon and your ability to lose part of this savings. Do not invest if you are not ready to lose all or part of your capital.
To go further, read our Financial Situation, Media Transparency and Legal Notices pages.


;Resize=(1200,627)&hash=0cdbeccf426ef54d2f11c7cf7b1046d704eccc253aaa224c390a267be6f9b702)